A TornadoFx wrapper for Mule 4 Secure Properties

Adding a GUI wrapper around Mule 4 secure properties

In an earlier post we discussed Securing your Mule 4 properties and your feedback was great. While most of you liked the approach, others felt it was a little too techie for their DevSecOps teams. The feeling was that: there were too many moving parts and the consensus was for a GUI to wrap the encode and decode details.

To that end, I created a GUI wrapper using TornadoFx. You will still need to download the Mule 4 secure-properties-tool.jar that I linked in my previous article. Also, I posted an Uber Jar (not the car hailing company) to my GitHub project packages. The Uber Jar will need to be run from the same folder where you downloaded the mule jar as is shown in the code snippet below.

# list of files
$ ls
secure-properties-tool.jar
SecureProps-0.0.1.jar

# run the jar
$ java -jar SecureProps-0.0.1.jar

When you run the Uber Jar, the SecureProps EncDec application will start up giving your the opportunity to encode or decode your secrets.

Wrapping Mule 4 secure properties
Wrapping Mule 4 secure properties with TornadoFx

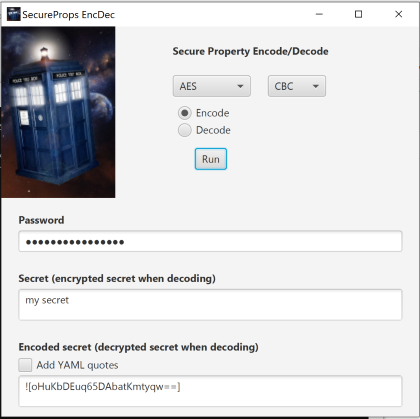
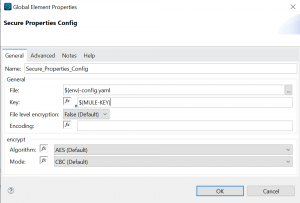
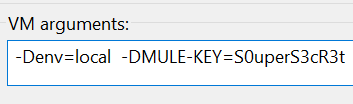
In the Secure Properties GUI select the crypto algorithm and cipher you wish to use. The password is the same mule will use to decode the properties at startup. You’ll add your secret to the secret field and press Run to generate the encoding. The default encoding is for insertion in a .properties file. To produce an encoding for a YAML file be sure to click on the checkbox before hitting the Run button. You can always reverse the process by adding the encoding to the secret field. Just be sure not to include the ![] which wraps the encoding.

Hopefully this will allay the earlier concerns about simplifying the encoding process. In the space that remains i’ll hit some of the high points about TornadoFx and the application.

What is TornadoFx and why is it relevant?

The TornadoFx is a GUI development framework created by Edvin Syse, as a lightweight JavaFx development framework developed in Kotlin.

There’s a lot of info packed into the links above, but probably the main question most people have is: how long will it take to learn a new framework start doing building cool UI’s using TornadoFx? The answer of course is it depends. It depends on whether you’re just starting or have some background in JavaFx, JavaScript, Web development frameworks and the like.

The good news is that TornadoFx extends on the basic concepts of other UI development frameworks, so if you’ve have some prior experience and an understanding of MVC patterns you should be in good shape.

To get you started, you can find the code for the Mule Secure properties app in my GitHub repository. The Uber jar is also there if you would just like to use it for securing your Mule 4 properties. While useful, it’s still an immature version which doesn’t validate any of the parameters you send to the Mule Jar. For example, it will be perfectly happy accepting a password length that’s unacceptable to algorithms like AES which require 16 bytes and you might get results like this: “Invalid AES key length: 8 bytes“. As long as you conform to the happy path it should work fine and acceptable for a non-production grade demo app.

Lets take a look at some code. To run you application, we’ll wrap the JavaFx Stage adds the dimensions for our window, overrides the default application icon with one of our own and passes our MainView class as our view entry point.

class MyApp: App(MainView::class, Styles::class) {
    override fun start(stage: Stage) {
        with (stage) {
            width = 500.0
            height = 490.0
        }
        setStageIcon(Image("images/Favicon.png"))
        super.start(stage)
    }
}

Our MainView and EncDecController fulfills the contractual obligations described by the MVC pattern. Our controller runExec method executes’s the Mule 4 Secure properties config jar, encoding or decoding our secret, using an asynchronous pattern so that our UI view thread doesn’t block. It takes a string as an argument, which we entered manually to the jar when we first reviewed the Mule jar in our last article.

fun runExec(cmd: String) {

        val process: Process = Runtime.getRuntime().exec(cmd)

        val sc = Scanner(process.inputStream)
        conversionRes = SimpleStringProperty(sc.nextLine())

        //println(res)
        sc.close()
}

In the MainView.kt you’ll find most of our UI controls and layout styles. Though, you will probably want to consolidate and centralize most of your layout definitions in a file like the Styles.kt, which is similar in nature to a styles.css. For a better understanding of how Layouts and Controls work in TornadoFx you’ll probably want to review Edvin’s TornadoFx guide. To make you even more productive, Edvin has created a TornadoFx plugin for IntelliJ Idea.

To bootstrap your knowledge even faster you might want to consider taking a Udemy course like Paulo Dichone’s TornadoFx course.

Whether you’re inspired to create your own TornadoFx application or just use one, like this one, I hope you found this an interesting read and that the links help to get you up to speed quickly. As always, I look forward to your feedback and thoughts on improvements.

Lifting Kubernetes up to the cloud

We’ve explored Kubernetes in our laptop sandbox, lets take what we’ve learned and move it to the Google Cloud Platform (GCP).

In our recent post Getting started with Kubernetes, we went through a few examples of running Kubernetes applications in our laptop Docker sandbox environments. Lets take what we’ve learned so far and run the in the GCP.

To get started, log into the Google Cloud Console using your Google account. At the time of this writing, GCP gives your $300 in credit or a full year of free service, whichever comes first. When getting started, I would recommend using smaller virtual machines and stop your clusters when they’re not being used. If you leave a modest 3 VM cluster running it may cost you around $3 – $5 per day of your free $300 credit. Watch the daily billing and it will give you a better idea what your costs will be as you deploy production applications to the cloud.

It’s up to you to keep an eye on your billing. If you leave your clusters up and running for a few month or forget about them, it may burn through your credits and start charging you for services. If you don’t plan on using your services for a while, stop your cluster and make sure the billing stops over the next few days.

Select Clusters

Begin by selecting the Clusters tab. In the center of the display we’re going to choose the Create cluster option.

I named my cluster: playing-with-kubernetes. Choose a Zone close to you and the default static GKE version.

Choose next on the cluster creation Tab.

In step 2 of 3 in the cluster creation tab we’re advised to review the Node Pools in the Left menu to configure security and metadata. We’ll be selecting defaults so click to advance to step 3 of 3. Step 3 advises us to review and possibly create a node pool. Pools are specialized configurations of nodes and node configurations. We won’t be creating different configurations in our example, but this is something you’ll want to go back and review when creating specialized deployments. Go ahead and click Done. We’ll be sticking with the defaults for these exercises so go ahead and click Create to begin the Cluster creation.

After about 5 – 10 minutes you should see that your cluster creation has completed. By default you should have a 3 node cluster running. Click on the cluster name and you’ll see the details about your cluster. The Nodes table will give you details about each node in the cluster.

While you can run a cloud shell from the browser, I find it clunky for all but running a few simple commands. Instead, go ahead and download the Cloud SDK Installer. Run the SDK install, when it completes you’ll be presented with a browser window when you’ll need to approve access by the SDK to your Google Cloud account.

After you’ve approved the access you can close the shell. Go back to your browser window and click the Clusters menu, next click on the cluster name. Click the Connect menu at the top, then click on the Copy button to copy the gcloud command-line access string to the clipboard. On your laptop open a new Google Cloud SDK shell and paste this line into it, run the command and it will initialize to use your cluster.

Verify the SDK shell can connect to cluster

$ kubectl version
Client Version: version.Info{Major:"1", Minor:"15", GitVersion:"v1.15.5", GitCommit:"20c265fef0741dd71a66480e35bd69f18351daea", GitTreeState:"clean", BuildDate:"2019-10-15T19:16:51Z", GoVersion:"go1.12.10", Compiler:"gc", Platform:"windows/amd64"}
Server Version: version.Info{Major:"1", Minor:"14+", GitVersion:"v1.14.10-gke.17", GitCommit:"bdceba0734835c6cb1acbd1c447caf17d8613b44", GitTreeState:"clean", BuildDate:"2020-01-17T23:10:13Z", GoVersion:"go1.12.12b4", Compiler:"gc", Platform:"linux/amd64"}

You should get back the client and server versions. Now you can deploy the service we created earlier in our Getting started with Kubernetes lesson.

Deploy our basic service

# deploy the image
$ kubectl create deployment basic-svc --image mitchd/basic-svc

# verify everything worked
$ kubectl get events

After our basic service has been deployed we’ll need to expose it to the outside world and open a port.

Expose service on port 8083

$ kubectl expose deployment basic-svc --type=LoadBalancer --port 8083
GCP Services & Ingres
Select Services & Ingres tab

From the GCP menu select the Services & Ingress option to verify that the basic-svc is deployed and you’ll see the IP address that the Load Balancer is running on.

You should now be able to click on the load balancer link and invoke the health endpoint in the browser.

Now we can scale up our application and send some messages.

Scale our solution

# Scale up
kubectl scale deployment basic-svc --replicas 3

# Verify we have 3 pods running now
$ kubectl get pods

Now you can run httpie or curl sending to the load balancer and watch the results to see the IP address of the POD changing. Note: this may not work when using the browser, as the browser will tend to keep the TCP connection alive. Withe httpie and curl you get a new TCP connection each time.

# send message to our cluster
$ http <cluster-address>:8083/health
HTTP/1.1 200 OK
Content-Length: 66
Content-Type: application/json
Date: Sun, 01 Mar 2020 21:30:01 GMT

{
    "Hostname": "basic-svc-599c64c6b9-9hmzn",
    "IpAddress": "10.24.5.11"
}

$ http <cluster-address>:8083/health
HTTP/1.1 200 OK
Content-Length: 66
Content-Type: application/json
Date: Sun, 01 Mar 2020 21:30:07 GMT

{
    "Hostname": "basic-svc-599c64c6b9-9hmzn",
    "IpAddress": "10.24.5.12"
}

$ http <cluster-address>:8083/health
HTTP/1.1 200 OK
Content-Length: 66
Content-Type: application/json
Date: Sun, 01 Mar 2020 21:30:11 GMT

{
    "Hostname": "basic-svc-599c64c6b9-9hmzn",
    "IpAddress": "10.24.5.5"
}

With our successful deployment to the Google Cloud you can get a better feel for how to get around and play more with your deployment. You may want to go through the rest of the commands we played with in our Getting started with Kubernetes lesson to verify everything works the same.

When you’re done be sure to clean up your environment to stop incurring charges.

Cleanup

# to delete deployment
$ kubectl delete service basic-svc

# Delete deployment
$ kubectl delete deployment basic-svc

When done, be sure to Delete your cluster and verify it has been deleted using the Cloud Console browser window.

Preparing for the IOT

Upgrading my Raspberry Pi 4 case in preparation for IOT projects

Whenever I needed to connect my GPIO ribbon cable to my Raspberry Pi 4 it always seemed harder than it should. Unscrewing the case, plugging in the cable, reassembling and then reversing it all when i’m done.

I kept thinking to myself that there had to be a better way … and then I discovered the new Miuzei Solid Aluminum Raspberry Pi case. The case is a sleek elegant design which stands out way ahead of the rest. When you feel the case in the palm of your hand, rotating it to check out the accessibility of the Micro SD, camera port, micro HDMI and headpone jack i’m sure you’ll agree this case is in a class by itself. No cheap plastic in this baby.

Miuzei-Alum-Case
New Miuzei Raspberry Pi aluminum case. A solid case and elegant design.

For your IOT projects you can easily plug and unplug the ribbon cable to your design breadboard. Take a look below at how easy it comes together.

Miuzei-Alum-Case-IOT
Miuzei Raspberry Pi aluminum case with GPIO ribbon connected to breadboard.

The case installation, by far was the simplest I’ve done for the Raspberry Pi. Total time was probably less than 3 minutes, certainly less than the videos below.

In the next video I show the ease of access to the GPIO and ports.

With a great Rapsberry Pi case like this who wouldn’t get excited about creating an IOT projects? I sure am, but may have to wait until after my post on running Kubernetes in the Google Cloud.

Getting started with Kubernetes

There’s many great options for getting started with Kubernetes and most are easier to get moving forward with than ever before. Friction has been greatly reduced.

Kubernetes is a cooperating set of nodes in a clufster which can scale on demand to handle fluctuating workloads. The control plane manages the scalability and fault tolerance of nodes in the cluster. Nodes will run some number of pods and generally a single container within a pod, though there are use cases where you might find a sidecar pod which provides reference data or other support to the pod.

Containers which run in the pods may be Docker containers, but they don’t have to be. They might be CoreOS, Rocket (rkt) or some other container. In the examples which follow we’ll be leveraging a Docker container we built in a previous example.

Kubernetes cluster and dependencies

The API server is the glue which binds everything together and will be the entry point into Kubernetes that we’ll leverage through kubectl. For a more complete understanding of how things work you should visit the Kubernetes Documents Home.

While there’s many great environments for learning Kubernetes such as:

In the examples which follow we’ll use Docker Desktop with Kubernetes.

Install Docker Desktop for your OS version

If all goes well with the Docker Desktop install you can right click the tray icon, click settings and the Desktop should show Docker and Kubernetes both running.

As a prerequisite for the examples i’ve created a Simple Micro Service in Go which we’ll deploy to Kubernetes. Or if you prefer, you can pull the container from my Docker repo.

If you use my Docker repo version, i’ve been adding some enrichment’s which aren’t reflected in the Simple Micro Service post.

# pulling container from Docker Hub
$ docker pull mitchd/basic-svc:latest

If the install was too easy for you, or if you would prefer to understand in detail how all the moving parts are working, I recommend you visit Kelsey Hightower’s – Kubernetes the hard way.

My examples were run on:

Docker Engine: v19.03.5

Kubernetes: v1.15.5

Kubernetes Examples

# Getting info about your Kubernetes cluster
kubectl cluster-info

Kubernetes master is running at https://kubernetes.docker.internal:6443
KubeDNS is running at https://kubernetes.docker.internal:6443/api/v1/namespaces/kube-system/services/kube-dns:dns/proxy

If Kubernetes is up and running you should see a message indicating the locations where Kubernetes and KubeDNS are running. The kubectl get command will provide you with info about your pods, replicasets, deployments and services. We’ll go through some examples shortly.

As you gain experience with Kubernetes most of your interactions will be performed by sending in YAML files. YAML can be pretty fussy about indentation and spacing, so if it’s new to you try be sure to review some background material before going forward.

The kubctl get comand sets will also allow you to pass a -o flag to view a wide output or format the results as YAML or JSON. The YAML you create will usually be enriched with additional details after it’s submitted to Kubernetes. What comes back out is usually much more expansive than what went in.

Example YAML file to deploy our pod – scripts/pod-def.yaml

apiVersion: v1

kind: Pod

metadata:
  name: myapp-pod
  labels:
    app: myapp
    mylabel: demo-purposes
    location: dev
    aka: crash-dummy
  
spec:
  containers:
  - image: mitchd/basic-svc
    name: mysvc
    ports:
    - containerPort: 8083
      protocol: TCP

As you can see in the title above I keep my YAML files in a scripts folder, this one is located relative to the current directory in scripts/pod-def.yaml. Lets go ahead and create our pod and deploy the container to it. Many kubectl commands can be abbreviated, we’ll cover them as we go along.

Create pod, deploy container

$ kubectl create -f scripts\pod-def.yaml
pod/myapp-pod created

# lets see if our pod is running
$ kubectl get pods
NAME        READY   STATUS    RESTARTS   AGE
myapp-pod   1/1     Running   0          69s

# the abbreviation for pods is po
# get the info for just our pod, as you build our your cluster 'get all' may show many pods
kubectl get po myapp-pod

# Wide listing
kubectl get pods -o wide
NAME        READY   STATUS    RESTARTS   AGE     IP          NODE             NOMINATED NODE   READINESS GATES
myapp-pod   1/1     Running   0          4m34s   10.1.0.32   docker-desktop   <none>           <none>

YAML file enriched by Kubernetes

# specify output as yaml, you can redirect to a file and use it later in a create
# kubectl get po myapp-pod -o yaml > scripts/my-pod.yaml
$ kubectl get po myapp-pod -o yaml

apiVersion: v1
kind: Pod
metadata:
  creationTimestamp: "2020-02-18T16:01:12Z"
  labels:
    aka: crash-dummy
    app: myapp
    location: dev
    mylabel: demo-purposes
  name: myapp-pod
  namespace: default
  resourceVersion: "285048"
  selfLink: /api/v1/namespaces/default/pods/myapp-pod
  uid: f9b49794-5f1b-49d2-b027-9659943dee69
spec:
  containers:
  - image: mitchd/basic-svc
    imagePullPolicy: Always
    name: mysvc
    ports:
    - containerPort: 8083
      protocol: TCP
    resources: {}
    terminationMessagePath: /dev/termination-log
    terminationMessagePolicy: File
    volumeMounts:
    - mountPath: /var/run/secrets/kubernetes.io/serviceaccount
      name: default-token-zjzrf
      readOnly: true
  dnsPolicy: ClusterFirst
  enableServiceLinks: true
  nodeName: docker-desktop
  priority: 0
  restartPolicy: Always
  schedulerName: default-scheduler
  securityContext: {}
  serviceAccount: default
  serviceAccountName: default
  terminationGracePeriodSeconds: 30
  tolerations:
  - effect: NoExecute
    key: node.kubernetes.io/not-ready
    operator: Exists
    tolerationSeconds: 300
  - effect: NoExecute
    key: node.kubernetes.io/unreachable
    operator: Exists
    tolerationSeconds: 300
  volumes:
  - name: default-token-zjzrf
    secret:
      defaultMode: 420
      secretName: default-token-zjzrf
status:
  conditions:
  - lastProbeTime: null
    lastTransitionTime: "2020-02-18T16:01:12Z"
    status: "True"
    type: Initialized
  - lastProbeTime: null
    lastTransitionTime: "2020-02-18T16:01:14Z"
    status: "True"
    type: Ready
  - lastProbeTime: null
    lastTransitionTime: "2020-02-18T16:01:14Z"
    status: "True"
    type: ContainersReady
  - lastProbeTime: null
    lastTransitionTime: "2020-02-18T16:01:12Z"
    status: "True"
    type: PodScheduled
  containerStatuses:
  - containerID: docker://b17bdfb94ea8ec98cc8cf32d55044ef022b8f243972f45fceb841d26114a60fb
    image: mitchd/basic-svc:latest
    imageID: docker-pullable://mitchd/basic-svc@sha256:bb68e84c2fffedcb731b07c69006af21090cc715a99f5ba8c8fd10e80d67a6ae
    lastState: {}
    name: mysvc
    ready: true
    restartCount: 0
    state:
      running:
        startedAt: "2020-02-18T16:01:13Z"
  hostIP: 192.168.65.3
  phase: Running
  podIP: 10.1.0.32
  qosClass: BestEffort
  startTime: "2020-02-18T16:01:12Z"

As you can see that a lot more info than what we started with!

Deploy another container instance

# Deploy another instance of our service
$ kubectl run mysvc --image mitchd/basic-svc
deployment.apps/mysvc created

$ kubectl get all
NAME                         READY   STATUS    RESTARTS   AGE
pod/myapp-pod                1/1     Running   0          43m
pod/mysvc-798c7d6fd8-h4bs5   1/1     Running   0          8s


NAME                 TYPE        CLUSTER-IP   EXTERNAL-IP   PORT(S)   AGE
service/kubernetes   ClusterIP   10.96.0.1    <none>        443/TCP   66m


NAME                    READY   UP-TO-DATE   AVAILABLE   AGE
deployment.apps/mysvc   1/1     1            1           8s

NAME                               DESIRED   CURRENT   READY   AGE
replicaset.apps/mysvc-798c7d6fd8   1         1         1       8s

Note that we we use the run command, we now have a deployment, service and replicaset created.

When we created our initial YAML description we added some labels. The labels allow for a number of different types of searches. When there’s a large number of pods deployed in a cluster, you’ll want to filter down to a smaller set that you’re interested in. Note that the generated names will be different for your instance.

Label Examples

# Search for pods labeled as app and aka
$ kubectl get po -L app,aka
NAME                     READY   STATUS    RESTARTS   AGE     APP     AKA
myapp-pod                1/1     Running   0          50m     myapp   crash-dummy
mysvc-798c7d6fd8-h4bs5   1/1     Running   0          7m17s

# Now retrieve just those pods that have our label
$ kubectl get po -l aka
NAME        READY   STATUS    RESTARTS   AGE
myapp-pod   1/1     Running   0          51m

# return pods with no label aka
$ kubectl get po -l "!aka"
NAME                     READY   STATUS    RESTARTS   AGE
mysvc-798c7d6fd8-h4bs5   1/1     Running   0          11m

Logging examples

# view log of our service, to tail the log use: logs -f
$ kubectl logs myapp-pod
2020/02/18 16:01:13 Basic service running: http://0.0.0.0:8083

Typically our services will be behind a load balancer and inbound requests will be distributed to the instances. But, there are times where you might want to send messages for debugging purposes to a specific instance. To do that you could create a port forwarder. Open a new shell to run the port forwarding proxy and in another send some messages.

# create a port forwarder
$ kubectl port-forward myapp-pod 8083:8083 
Forwarding from 127.0.0.1:8083 -> 8083
Forwarding from [::1]:8083 -> 8083

# send a message using httpie
#   in curl: curl http://localhost:8083/health
$ http :8083/health
HTTP/1.1 200 OK
Content-Length: 48
Content-Type: application/json; charset=utf-8
Date: Tue, 18 Feb 2020 17:07:29 GMT

{
    "Hostname": "myapp-pod",
    "IpAddress": "10.1.0.32"
}

When you’re done with the port forwarder, enter ^C in the terminal.

We’ve come a long way in these examples together. In a future post we’ll take a look at different Kubernetes controllers. Now like good campers we’ll clean up our site before moving on.

Clean-up environment

# nuclear option
# kubectl delete all --all

# lets get the names of the pods and controllers your running and delete each
$ kubectl get all

$ kubectl delete deployment.apps/mysvc

# now delete our service pod
$ kubectl delete pod/myapp-pod

Securing Mule 4 config properties

In this article we’ll demonstrate how to secure your MuleSoft properties and prevent their leakage into Github source code repositories.

Use Case

  • Secure your passwords to prevent break-ins and other misuse.

There’s probably not much more that needs to be said about securing passwords, other than you need to do it. It’s likely that your organization audits source repositories regularly and you should get out ahead of Best Practices. If you’d like some additional backgrounder in password strength or passwords which are easily cracked, the prior OWASP links are a great start.

MuleSoft versions this is known to work with: 4.2

Link to MuleSoft reference documentation

For those of you that have configured Mule Vault to secure your properties in the 3.x version, there’s a few differences you’ll find in 4.x. The first thing you’re going to need to do is download and install the Mule Secure Configuration Properties Extension from Anypoint Exchange. The picture below shows you what you’re looking for.

Mule Secure Configuration Properties Extension
Install the Mule Secure Configuration Properties Extension from Anypoint Exchange

With the Secure Configuration Property Extension installed you ‘ll next set the configuration properties to identify the secret key and property file. The secret key will be used by Mule to decode the encrypted property.

Setting up the secure properties config
The secret key and environment property file specification are injected as properties into the runtime.

In the General section above we’re using the ${env} property as a prefix to our property file. The reason for this is to make our approach extensible to the environments we’ll deploy into. Our approach will work well with the environments and property files shown below.

Example environments and property files

local-config.yaml
Dev-config.yaml
Test-config.yaml
Prod-config.yaml

For our secret, we pass the property when running in Anypoint Studio like this:

Pass secure key in AnyPoint Studio
Secure properties differ in the runtime environments. Define your env and secret key as properties.

The env and secret are passed as VM args using -D when the JVM runs our application. When running in the Mule runtime engine you’ll need to inject the environment and property in the same way, but by adding them to the next available -D option in the wrapper.conf file. While this approach is mostly secure, and gets plain text passwords out of git repositories, it still has minor weaknesses that may not satisfy financial institutions or the ultra-paranoid. In high value environments there is still the risk of secret key being compromised in a file or the processes in memory instance. Weigh these considerations and risks carefully.

With your secret key added and the property file naming conventions properly established, you are ready to start encoding the properties that you wish to keep secret. In the prior version Mule 3 Vault application, the encode/decode process was somewhat simplified by using the secure property config editor. I imagine at some point this capability will return to 4.x as the product suite continues to mature, until the we’ll need to roll-up our sleeves and obscure our secrets the old fashioned way.

Lets start by downloading the encode/decode Jar file.

Encode and decode secure properties

# To encode your properties, our secret below is: keep-me-secret
# For AES CBC you will need a 16 byte key like this one: mulesofttfoselum
# See the Mule reference documentation for field descriptions
$ java -jar secure-properties-tool.jar \
    string encrypt AES CBC \
    mulesofttfoselum "keep-me-secret"

# Here's the encoded secret we produced
VAKvdYl7bgfYPVYjvLSXqA==

# If you forget your original password, you  
# can use reverse the process decode the secret
$ java -jar secure-properties-tool.jar \
    string decrypt AES CBC \
    mulesofttfoselum \
   "VAKvdYl7bgfYPVYjvLSXqA=="

# Here's the decoded secret we produced
keep-me-secret 

We’re almost done! When you’ve encoded your secrets, you can now add them to our yaml property file. If your properties are in yaml files they’ll need to be quoted. For the properties stored in legacy property files that end with .properties don’t use quotes.

Example snippet of yaml file secure property configutration

...
mySecret:
  dontTell: "![VAKvdYl7bgfYPVYjvLSXqA==]"

The yaml encoding needs to be quoted as you see above, if you’re using a legacy .properties it will look like this:

Example snippet of a legacy .properties file

mySecret.dontTell=![VAKvdYl7bgfYPVYjvLSXqA==]

When the mule engine is starting, either in AnyPoint or the standalone Mule application, it will detect that you’re configured to use secure properties. During startup it will decode the secure properties using the secret key you’ve injected and your connectors and resources will be able to use them just like normal.

If you were to print one of your secure properties in a Logger, it would display it’s decoded value. This is a handy way to test whether you’ve properly configured your settings. Just remember to remove the log message when you’re confident the solution is working properly.

Note: property prefix secure:: must be included in the string interpolation.

#[Enter with ${secure::mySecret.dontTell}]

That’s all there is to it, with these simple changes in place your application will be much more secure and compliant with a devsecops best practice.

Simple micro service in Go

In this post we’re going to create a simple microservice in Go. We’ll go on to deploy our simple service in Docker and prepare for some exercises in Kubernetes.

The Dockerfile below is a multistage build file, which will compile our microservice as a Linux app which later will run in a Linux container. I’m building the container on a Windows 10 laptop, providing the directive GOOS=linux during the build stage, to cross-compile as a Linux executable application.

For a better understanding about Go environment settings, see my article environment-variables-in-go.

My source directory is located in my GOPATH here:

# GOPATH
C:\Home\dev\Go\src\github.com\mjd\basic-svc

# dir
.gitignore  Dockerfile  main.go  README.md

Dockerfile settings:

# Dockerfile
FROM golang

ADD . /go/src/github.com/mjd/basic-svc

# Build our app for Linux
RUN go install github.com/mjd/basic-svc

# Run the basic-svc command by default when the container starts.
ENTRYPOINT /go/bin/basic-svc

# Document that the service listens on port 8083
EXPOSE 8083

Our microservice application will use the Go http package to provide services for:

  • health
  • version
  • greet

main.go

package main

import (
	"context"
	"fmt"
	"log"
	"net/http"
	"os"
	"os/signal"
	"syscall"
)

const (
	version = "v1.0.0"
	addr    = "0.0.0.0:8083"
)

func main() {
	msg := fmt.Sprintf("Basic service running: http://%s", addr)
	log.Println(msg)

        // Configure API handlers
	http.HandleFunc("/greet", 
          func(w http.ResponseWriter, r *http.Request {
		fmt.Fprintf(w, "Howdy\n")
	})

	http.HandleFunc("/health", 
          func(w http.ResponseWriter, r *http.Request) {
		w.WriteHeader(http.StatusOK)
		fmt.Fprintf(w, "okie-dokie\n")
	})

	http.HandleFunc("/version", 
          func(w http.ResponseWriter, r *http.Request) {
		fmt.Fprintf(w, version)
	})

        // Listen for inbound API connections
	s := http.Server{Addr: addr}
	go func() {
		log.Fatal(s.ListenAndServe())
	}()

        // Signal handlers to terminate service
	signalChan := make(chan os.Signal, 1)
	signal.Notify(signalChan, syscall.SIGINT, syscall.SIGTERM)
	<-signalChan

	log.Println("Basic service received exit signal")

	s.Shutdown(context.Background())
}

The health API is typically utilized by load balancers to check the liveness of our application. If our application doesn’t answer after a predetermined number of requests a replicator will start a new instance. Version and greet are just other endpoints for our simple service. Our application will listen for incoming HTTP requests on port 8083.

When ListenAndServe is invoked, our application will respond to inbound requests and continue running until terminated by a Control-C (^C) from the console, or is sent a Linux kill signal.

Building the Dockerfile

# build Dockerfile
docker build -t mitchd/basic-svc .

# run the container
docker run -itd -p 8083:8083 --name mysvc mitchd/basic-svc

With the docker container now running you can exercise the services using the browser, curl, httpie or your favorite testing tool. I’ll show examples using httpie.

# curl example:  curl -i http://localhost:8083/greet
# httpie example
$ http :8083/greet
HTTP/1.1 200 OK
Content-Length: 6
Content-Type: text/plain; charset=utf-8
Date: Sun, 16 Feb 2020 22:57:33 GMT

Howdy

# version
$ http :8083/version
HTTP/1.1 200 OK
Content-Length: 6
Content-Type: text/plain; charset=utf-8
Date: Sun, 16 Feb 2020 23:00:23 GMT

v1.0.0

# health
$ http :8083/health
HTTP/1.1 200 OK
Content-Length: 11
Content-Type: text/plain; charset=utf-8
Date: Sun, 16 Feb 2020 23:00:55 GMT

okie-dokie

With our simple microservice running in a Docker container, we’re now ready to push it out into our Kubernetes cluster and perform some basic operations. We’ll do this in our next post.

Clean up

# stop the running service instance
$ docker stop mysvc

# remove the container
$ docker rm mysvc

# remove the image
$ docker rmi mitchd/basic-svc

WSL while you work

With the Windows Subsystem for Linux (WSL) you may indeed want to whistle while you work!

The WSL is faster than a standard VM and doesn’t require that you run Docker for windows to run a Linux container. It’s quite refreshing to be able to run Windows and Linux together with a minimum amount of effort. Having said that, i’m not quite ready to give up on my Raspberry Pi’s yet…

WSL is great for developers who need to build solutions which run in both environments. It’s also great when you want to run bash or Linux commands from Windows without having to install Cygwin or a similar version. The WSL is primarily a command line interface and not intended for GUI environments like KDE and Gnome. Be sure to review the FAQ’s to ensure WSL will fit your Uses Cases.

Simply follow the Microsoft WSL install guidelines and choose your Linux distribution from the Microsoft store and you’re good to go. I chose the Ubuntu 18.04.3 LTS release and am curious to try the Alpine.

# be sure to update and upgrade often
sudo apt update && sudo apt upgrade

With WSL installed you’ll be able to seamlessly interoperate between Windows and Linux shells. Just be sure when you want to run a Windows native command from Linux, to include the command extension. For example, if you want to run Notepad you would enter notepad.exe.

Note: you must add the .exe extension as notepad.exe above.

# example running windows ipconfig command from linux
root@Me-YT:~# ipconfig.exe | grep IPv4 | cut -d: -f 2
192.168.1.42

Similarly you can run Linux commands from Windows as long as you prefix the command with wsl first.

# run linux commands from windows
C:\Home\dev\Go\src\github.com\me\sandbox>wsl ls
cert.pem  file.txt  key.pem  serve.go  sha1sum.go  simple_server.go

# example running grep through wsl
C:\> wsl grep  sha1ForFile sha1sum.go
                sha1ForFile(*file)
                sha1ForFile("file.txt")
func sha1ForFile (fileName string) {

You can access the Windows filesystem through Linux, it’s mounted to the /mnt folder.

# windows filesystem mounted to /mnt
root@Me-YT:~# ls /mnt/c/Tools
Go  Install  PuTTY  apache-maven-3.6.3  bin  cygwin

If you need to pass arguments to a command you can include them in quotes.

# example using bash from windows to run a linux command
#  arguments are passed in quotes
bash -c "ls -lrt"
total 12
-rwxrwxrwx 1 root root 1094 Jan 23 11:32 cert.pem
-rwxrwxrwx 1 root root 1704 Jan 23 11:32 key.pem
-rwxrwxrwx 1 root root  205 Jan 23 11:34 serve.go
-rwxrwxrwx 1 root root   38 Jan 24 08:11 file.txt
-rwxrwxrwx 1 root root  562 Jan 24 15:30 simple_server.go
-rwxrwxrwx 1 root root  977 Jan 24 15:43 sha1sum.go

This should be enough to get you started. I hope you found this an interesting read and look forward to your comments.

Batten down the Etcd hatches

When exploring new technologies we used to tend to take on a laissez-faire attitude. Our time and attention was typically involved with getting complex systems up and running. However, even in these early stages, we need to keep an eye toward securing the solution. Our DevOps focus evolves into a new, more holistic DevSecOps approach. With DevSecOps we layer security into our application development end-to-end.

This means not just building an MVP, but building a secure, reliable MVP which can withstand the myriad of external threats. In the case of our earlier etcd implementation, it’s time to harden our solution by adding TLS between our clients and our distributed cluster.

When last we left our etcd implementation, we created a (3) node distributed cluster and created sample Key/Value pairs. Lets get started with the creation of secure TLS connections for our clients.

To create our cert we could use tools like openssl or cfssl, but since we’re working with Go we’ll create the cert using idiomatic go. Though, we’ll still use legacy tools to give you a flavor for what’s going on behind the scenes.

First we’ll need to install the generate cert utility if you haven’t already done so. With generate cert built and installed let’s create a self signed cert for out 3-node cluster. Choose a folder and run the generate cert utility providing the IP address, hostname and flag to self sign the certificate.

# generate self signed certificate for all 3-nodes in our cluster
generate_cert --host \
   viper,192.168.1.167,cobra,192.168.1.184,sidewinder,192.168.1.182 --ca

Generate cert will create cert.pem and key.pem. If you have openssl installed you can verify the issuer is the same as the subject (self signed) like this.

openssl x509 -in cert.pem -inform PEM -noout -subject -issuer

If you’re running on windows the Git bash shell will let you use openssl

If you have java installed you can use keytool to list the certificate info.

# use java keytool to list the cert
keytool -printcert -file cert.pem

With the cert created copy it to a location you will reference it from on node1.

Here’s the original run script we used for Node1:

# For machine 1
THIS_NAME=${NAME_1}
THIS_IP=${HOST_1}
etcd --data-dir=data.etcd --name ${THIS_NAME} \
	 --initial-advertise-peer-urls http://${THIS_IP}:2380 \
	 --listen-peer-urls http://${THIS_IP}:2380 \
	 --advertise-client-urls http://${THIS_IP}:2379 \
	 --listen-client-urls http://${THIS_IP}:2379 \
	 --initial-cluster ${CLUSTER} \
	 --initial-cluster-state ${CLUSTER_STATE} \
	 --initial-cluster-token ${TOKEN}

We’re going to modify the script above to change our client references to use secure TLS socket connections to communicate with node1.

# changes to the etcd run script for TLS

# Added env var references to location of cert and key
CERT_FILE=${HOME}/src/certs/167/cert.pem
CERT_KEY=${HOME}/src/certs/167/key.pem

# note: advertise-client-urls and listen-client-urls changed
#       to use https
etcd --data-dir=data.etcd --name ${THIS_NAME} \
        --cert-file ${CERT_FILE} --key-file ${CERT_KEY} \
        --initial-advertise-peer-urls http://${THIS_IP}:2380 \
        --listen-peer-urls http://${THIS_IP}:2380 \
        --advertise-client-urls https://${THIS_IP}:2379 \
        --listen-client-urls https://${THIS_IP}:2379 \
        --initial-cluster ${CLUSTER} \
        --initial-cluster-state ${CLUSTER_STATE} \
        --initial-cluster-token ${TOKEN}

Our changes to the script above now include references to the cert and key file we created with generate cert as well as changes from http to https for the client.

With these changes in place you can stop and start the etcd on node1 and we should be able to connect from our client using https. I’ll be using httpie, a curl like utility we described in our post getting started with etcd.

# here's a curl example:
#  curl --cacert cert.pem -L https://viper:2379/v3/kv/range \
#    -X POST -d '{"key": "Zm9v"}'

# connect to etcd using https and httpie client
http --verify=cert.pem POST https://viper:2379/v3/kv/range key=Zm9V

HTTP/1.1 200 OK
Access-Control-Allow-Headers: accept, content-type, authorization
Access-Control-Allow-Methods: POST, GET, OPTIONS, PUT, DELETE
Access-Control-Allow-Origin: *
Content-Length: 114
Content-Type: application/json
Date: Sun, 26 Jan 2020 18:33:31 GMT
Grpc-Metadata-Access-Control-Allow-Headers: accept, content-type, authorization
Grpc-Metadata-Access-Control-Allow-Methods: POST, GET, OPTIONS, PUT, DELETE
Grpc-Metadata-Access-Control-Allow-Origin: *
Grpc-Metadata-Content-Type: application/grpc
Grpc-Metadata-Trailer: Grpc-Status
Grpc-Metadata-Trailer: Grpc-Message
Grpc-Metadata-Trailer: Grpc-Status-Details-Bin

{
    "header": {
        "cluster_id": "8542102317057920171",
        "member_id": "16840390794084916863",
        "raft_term": "95",
        "revision": "5"
    }
}

If you try the same request using http you should now get a connection error.

http POST http://viper:2379/v3/kv/range key=Zm9V

http: error: ConnectionError: ('Connection aborted.', ConnectionResetError(10054
, 'An existing connection was forcibly closed by the remote host', None, 10054,
None)) while doing POST request to URL: http://viper:2379/v3/kv/range

However, since you haven’t configured node2 and node3 yet for https you should still be able to connect with http.

http POST http://cobra:2379/v3/kv/range key=Zm9V

HTTP/1.1 200 OK
Access-Control-Allow-Headers: accept, content-type, authorization
Access-Control-Allow-Methods: POST, GET, OPTIONS, PUT, DELETE
Access-Control-Allow-Origin: *
Content-Length: 113
Content-Type: application/json
Date: Sun, 26 Jan 2020 18:37:55 GMT
Grpc-Metadata-Content-Type: application/grpc

{
    "header": {
        "cluster_id": "8542102317057920171",
        "member_id": "2181031141463563501",
        "raft_term": "95",
        "revision": "5"
    }
}

You should go ahead and repeat the steps above to secure the client interaction on node2 and node3. At this point you should feel confident in configuring the connections between the cluster members to use TLS. Etcd will also permit you to secure 2-way TLS connections by providing client certs to the cluster members.

Our DevSecOps hardening is moving along well and our cluster security is tightening up.

I hope you enjoyed this post and it’s helped to make your own etcd configuration more secure!

Environment variables in Go

In the spirit of DRY (Don’t Repeat Yourself), I’ve created this post to cover some of the other environment variables which may not be exposed in a typical Go installation. In future post’s i’ll refer back to these guidelines to help others with their environment settings.

An complete list of Go environment can be found by searching the following page or this heading: General-purpose environment variables.

Usually the installation will create a GOPATH environment variable for you. This location will be the development tree that you’re working in. You can learn more about here about how to configure GOPATH for your environment.

The Go community seems to be leaning more toward thinning out the dependency on environment variables you need to configure by providing good default behaviors when they’re not set. A good example of this is in providing a default bin or pkg location where your executables and packages are installed.

# Linux default locations
$GOPATH/bin
$GOPATH/pkg

# Windows
%GOPATH%\bin
%GOPATH%\pkg

If you’re not yet seeing these locations you may not yet have built and installed an application or had any dependencies on packages.

These default locations are generally good, but there are times when you may need to override the default settings to help Go figure out your intent.

If you have multiple versions of Go installed you can identify the version you intend to use for a specific project by setting the GOROOT environment variable. In the prior link above to the Go document page, they describe this variable as: The root of the go tree. This is the folder location where Go is installed on your OS, which isn’t necessarily where your development tree is located. For me, when developing on Windows, I install Go in a tools folder like this.

# location of my Windows Go installation.
C:\Tools\Go

# env GOROOT setting
C:> set GOROOT=C:\Tools\Go

# location of my Go development tree
C:> echo %GOPATH%
C:\Home\Dev\Go

# on my linux Raspberry Pi go was installed here
/usr/lib/go-1.11/

# env setting
$ export GOROOT=/usr/lib/go-1.11/

# go path
$ echo $GOPATH
/home/mitch/src/go

I like to keep code and programs out of places where helpful admins or automated scripts will try to back them up. I don’t typically back up my code, I check it in to Github. And, I don’t backup my executables, if needed again I install them.

Install the generate_cert utility

Let’s set GOBIN so we can install from GOROOT to our GOPATH/bin folder. In my post on enabling TLS for etcd we have a dependence on the generate_cert utility which is included as source code. We will build and install this utility in our GOPATH/bin directory by setting the GOBIN environment variable to point to that location. When we run go install it will use GOBIN to determine where to copy the executable.

# set location of GOBIN in Linux
export GOBIN=$GOPATH/bin
cd $GOROOT/src/crypto/tls/
go install generate_cert.go

# Windows
set GOBIN=%GOPATH%\bin
cd %GOROOT%\src\crypto\tls
go install generate_cert.go

To make any of these environment changes permanent you might add them to your Linux .bashrc file or Windows environment settings. More details can be found in my earlier link above to configure GOPATH. I will typically add GOPATH/bin to my path so I can run all the way cool utilities I create.

# add to linux path in .bachrc
export PATH=$PATH:$GOPATH/bin

# somewhere, in my windows environment settings, i add to PATH
  ...;%GOPATH%\bin;...

There’s another handy environment variable GOARCH, that I discussed in my post cross compiling for the Raspberry Pi. By setting this variable you can build a Go executable on Windows, Linux, etc in the proper format to run on another target operating system and hardware.

To remain consistent with DRY, I may update this section in future posts that depend on environment variables for their use cases.

I hope you found this section helpful!

Getting started with Etcd

Application versions

The code used in this article is running the following versions:

  • etcd Version: 3.5.0-pre
  • etcd Git SHA: 45156cf3c
  • Go Version: go1.11.6
  • Go OS/Arch: linux/arm

Known caveats

  • None observed at this time

Etcd is a distributed Key/Value store written in the Go programming language. When you need a simple, highly performant, secure, scalable solution for managing data in a cluster etcd is a top contender. Technologies such as: Kubernetes, CoreDNS and openstack (to name a few) depend on etcd for managing state in their cluster.

The etcd depends on the Raft consensus algorithm for leader election and the sharing of state between cluster members. Should a failure occur, a new leader is elected and the distributed key/value store resumes operations. When configured properly, users shouldn’t be aware of any disruptions.

In the example below we’re going to install etcd on the Raspberry Pi configuration below.

etcd cluster on Pi4
Raspberry Pi4

CLI interactions with etcd depend on the etcdctl application. The etcdctl has several commands for managing the etcd cluster. We’ll use just a few basic commands in our setup below.

The Raspberry Pi ARM7 processor isn’t an approved platform for running etcd. If you’re like me and just want to play with etcd, you probably don’t care.

To install etcd on Raspberry Pi, I followed the instructions here for installing from the latest Github branch. As I have Go installed on my Pi, I attempted to run go get, but encountered several errors with packages required by the CLI control program. Next I tried the git clone and ./build which ran successfully, creating ./bin/etcd and ./bin/etcdctl.

Before running etcd you will need to set an environment variable ETCD_UNSUPPORTED_ARCH or you will get the following error:

# Without setting envvar on unsupported architecture etcd will stop
$ etcd
etcd on unsupported platform without ETCD_UNSUPPORTED_ARCH=arm set

Set the environment variable and you should be able to run etcd.

# set envvar
$ export ETCD_UNSUPPORTED_ARCH=arm
# check for version and note the warning about: unsupported architecture
$ etcd --version
running etcd on unsupported architecture "arm" since ETCD_UNSUPPORTED_ARCH is set
etcd Version: 3.5.0-pre
Git SHA: 45156cf3c
Go Version: go1.11.6
Go OS/Arch: linux/arm

Now we get get on with the cluster configuration on each Raspberry Pi. We’ll configure each Pi by setting environment variables to identify each host in the cluster.

# Cluster configiguration
TOKEN=token-01
CLUSTER_STATE=new
NAME_1=viper
NAME_2=cobra
NAME_3=sidewinder
HOST_1=192.168.1.167
HOST_2=192.168.1.184
HOST_3=192.168.1.182
CLUSTER=${NAME_1}=http://${HOST_1}:2380,${NAME_2}=http://${HOST_2}:2380,${NAME_3}=http://${HOST_3}:2380

With the environment variables configured for each cluster we can now start the etcd running on each. Be sure to choose the target specific section below for each Raspberry Pi cluster member.

# For machine 1
THIS_NAME=${NAME_1}
THIS_IP=${HOST_1}
etcd --data-dir=data.etcd --name ${THIS_NAME} \
	 --initial-advertise-peer-urls http://${THIS_IP}:2380 \
	 --listen-peer-urls http://${THIS_IP}:2380 \
	 --advertise-client-urls http://${THIS_IP}:2379 \
	 --listen-client-urls http://${THIS_IP}:2379 \
	 --initial-cluster ${CLUSTER} \
	 --initial-cluster-state ${CLUSTER_STATE} \
	 --initial-cluster-token ${TOKEN}

# For machine 2
THIS_NAME=${NAME_2}
THIS_IP=${HOST_2}
etcd --data-dir=data.etcd --name ${THIS_NAME} \
	 --initial-advertise-peer-urls http://${THIS_IP}:2380 \
	 --listen-peer-urls http://${THIS_IP}:2380 \
	 --advertise-client-urls http://${THIS_IP}:2379 \
	 --listen-client-urls http://${THIS_IP}:2379 \
	 --initial-cluster ${CLUSTER} \
	 --initial-cluster-state ${CLUSTER_STATE} \
	 --initial-cluster-token ${TOKEN}

# For machine 3
THIS_NAME=${NAME_3}
THIS_IP=${HOST_3}
etcd --data-dir=data.etcd --name ${THIS_NAME} \
	 --initial-advertise-peer-urls http://${THIS_IP}:2380 \
	 --listen-peer-urls http://${THIS_IP}:2380 \
	 --advertise-client-urls http://${THIS_IP}:2379 \
	 --listen-client-urls http://${THIS_IP}:2379 \
	 --initial-cluster ${CLUSTER} \
	 --initial-cluster-state ${CLUSTER_STATE} \
	 --initial-cluster-token ${TOKEN}

When you’ve verified that each cluster member is running correctly, you’re ready to create a Key/Value pair which will be published to the cluster.

Be sure to configure the environment variables needed by etcdctl on each Raspberry Pi in the cluster.

# configure environment for etcdctl on each host
export ETCDCTL_API=3
HOST_1=192.168.1.167
HOST_2=192.168.1.184
HOST_3=192.168.1.182
ENDPOINTS=$HOST_1:2379,$HOST_2:2379,$HOST_3:2379

# publish key/value pair
$ etcdctl --endpoints=$ENDPOINTS put foo bar

You can now verify the key/value pair is available on each cluster member.

$ etcdctl --endpoints=$ENDPOINTS get foo
foo
bar

With our custer running we can perform some simple operations. Here are some examples:

Watch a key while changing it’s value in another shell terminal.

# While watching foo, we change it's values in another shell
$ etcdctl --endpoints=$ENDPOINTS watch foo
PUT
foo
19.42
PUT
foo
buzz

Here’s some other interesting commands for you to try:

# Display cluster members formatted in a table
$ etcdctl --endpoints=$ENDPOINTS --write-out=table member list

# Display an entry as JSON, K/V is base64 encoded
$ etcdctl --endpoints=$ENDPOINTS --write-out=json get foo

# Display endpoint stats formatted in a table
$ etcdctl --endpoints=$ENDPOINTS --write-out=table endpoint status

# Take a point in time snapshot of a members state
$ FOR_ENDPOINT=192.168.1.182
$ etcdctl --endpoints=$FOR_ENDPOINT:2379 snapshot save my-snap.db
$ etcdctl --endpoints=$FOR_ENDPOINT:2379 --write-out=table snapshot \
    status my-snap.db
+----------+----------+------------+------------+
|   HASH   | REVISION | TOTAL KEYS | TOTAL SIZE |
+----------+----------+------------+------------+
| 3090b765 |        5 |         10 |      20 kB |
+----------+----------+------------+------------+

You can also send a JSON message to the cluster. Since version 3, the etcd API protocol uses grpc, so JSON requests will proxy through a grpc gateway. The grpc messages are byte arrays and marshal in base64 encoded format. The example below sends a JSON request through the gateway. You can use curl from Linux, or may prefer httpie if you have Python installed.

# send command to grpc gateway using httpie
#   install with pip:  pip install httpie
# the key: foo, base64 encoded is: Zm9v
$ http POST 192.168.1.182:2379/v3/kv/range key=Zm9v

# using curl you would wend the same command like this
$ curl -L http://192.168.1.182:2379/v3/kv/range \
    -X POST -d '{"key": "Zm9v"}'

# results will look like this
{
    "count": "1",
    "header": {
        "cluster_id": "8542102317057920171",
        "member_id": "12973437254233312577",
        "raft_term": "72",
        "revision": "5"
    },
    "kvs": [
        {
            "create_revision": "2",
            "key": "Zm9v",
            "mod_revision": "5",
            "value": "YnV6eg==",
            "version": "3"
        }
    ]
}

As you can see, the cluster is now configured and ready for more complex operations. I hope you’ll stay tuned for an upcoming post!