Persistent API’s using ORM in Go with Beego

A deeper look into using the Beego framework in Go for persisting stateful data

In a recent post we discussed the merits of using the Beego framework in Go to create Web and API projects. We went on to create a sample Web and API project using the CLI. The projects were simple to implement and came with a rich set of features including swagger documentation and built-in monitoring. Many of you were left wondering about the next steps, of adding a persistent set of new API’s to the framework set up by the CLI. That task will be the subject of this article.

To implement the API persistence layer we’ll be using a Postgres database. Beego also supports MySQL and SqLite. If you prefer to use these it should be simple enough to do so following the Beego ORM documentation. I’ve only tested with Postgres, other databases may require some addition tweaking on your part. To create a new Postgres instance you can refer to my instructions in Better practices for Go Databases.

With the caveats behind us, lets roll up our sleeves and get going!

Completed code in Github, branch wine-db.

Here’s what the completed project should look like, with a review of the changes from the default created with the CLI.

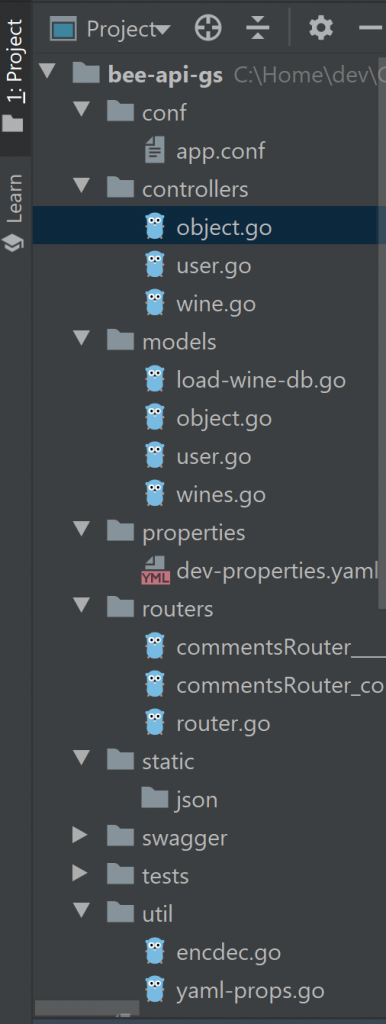
We’ve incorporated the YAML property file and encrypted properties which we created earlier in Better practices for Go Databases. To decode the secrets you’ll need to set or pass the secret environment variable as described in the article.

Also note that we’ve included new controller and models files wine.go. The router.go has been modified to support the new API route and main.go has been modified to support encrypted YAML properties and connection to Postgres.

I had hoped to use more of the raw primitives we used in the better practices article, but frameworks typically have their own ways of doing things and I was overcome by my curiosity to learn how to apply the Beego ORM framework. As we’ve already looked at the properties and utilities in the better practices article, we won’t repeat that again here.

Getting things started in main.go.

package main

import (
	"github.com/astaxie/beego/orm"
	"github.com/mjd/bee-api-gs/models"
	_ "github.com/mjd/bee-api-gs/routers"
	"github.com/mjd/bee-api-gs/util"
	"log"

	"github.com/astaxie/beego"
	_ "github.com/lib/pq"
)

// init behaves like an object constructor
func init () {

	// 1 - Enable debug
	orm.Debug = false

	// 2 - Register object with Beego ORM
	orm.RegisterModel(new(models.Wine))

	// 3 - Fetch database properties stored as YAML, decode secrets
	connStr, err := util.FetchYAML()
	if err != nil {
		log.Fatalf("error: %v", err)
	}

        // 4 - Register posgres driver and db
	orm.RegisterDriver("postgres", orm.DRPostgres)
	orm.RegisterDataBase("default", "postgres", connStr)

        // 5 - Create and load DB with sample data, can comment after initial load
	models.CreateDb()
	models.LoadDb()
}

func main() {

	// Load Beego framework
	if beego.BConfig.RunMode == "dev" {
		beego.BConfig.WebConfig.DirectoryIndex = true
		beego.BConfig.WebConfig.StaticDir["/swagger"] = "swagger"
	}
	beego.Run()
}

The main function remains untouched from what the CLI provided us. You’ll note the addition of init, which gets invoked by Go prior to any func’s being executed. The comments should give a good idea of what’s goin on in init().

  1. Enable debug, change to true for ORM debug
  2. Register Wine object with Beego ORM
  3. Fetch the database properties stored as YAML, decode secrets
  4. Register posgres driver and db
  5. Create and load DB with sample data, can comment after initial load

Router changes

func init() {
	ns := beego.NewNamespace("/v1",
		beego.NSNamespace("/object",
			beego.NSInclude(
				&controllers.ObjectController{},
			),
		),
		beego.NSNamespace("/user",
			beego.NSInclude(
				&controllers.UserController{},
			),
		),
		// New route for Wine API
		beego.NSNamespace("/wine",
			beego.NSInclude(
				&controllers.WineController{},
			),
		),
	)
	beego.AddNamespace(ns)
}

In router.go we added a new route to support CRUD operations for the Wine API, otherwise the other routes are the defaults provided by the CLI. In future articles i’ll be stripping out the artifacts which aren’t needed, but for now we’re just getting started and relate to the earlier work.

Create and Load static data with load-wine-db.go

package models

import (
	"fmt"
	"github.com/astaxie/beego/orm"
)

// Uses Beego ORM to create table
func CreateDb() error {

	// Database alias.
	name := "default"

	// Drop table and re-create (change to false after created).
	force := true

	// Print log.
	verbose := true

	// Beego ORM function to create the table
	err := orm.RunSyncdb(name, force, verbose)
	if err != nil {
		fmt.Println(err)
		return err
	}

	return nil
}

func LoadDb() error {

	// Some sample data to add to our DB
	wines := []Wine{
		{
			Product:     "SOMMELIER SELECT",
			Description: "Old vine Cabernet Sauvignon",
			Price:       159.99,
		},
		{
			Product:     "MASTER VINTNER",
			Description: "Pinot Noir captures luscious aromas",
			Price:       89.99,
		},
		{
			Product:     "WINEMAKER'S RESERVE",
			Description: "Merlot featuring complex flavors of cherry",
			Price:       84.99,
		},
		{
			Product:     "ITALIAN SANGIOVESE",
			Description: "Sangiovese grape is famous for its dry, bright cherry character",
			Price:       147.99,
		},
	}

	// Insert static entries into database
	for idx := 0; idx < len(wines); idx++ {
		w := wines[idx]
		_, err := AddWine(w)
		if err != nil {
			return err
		}
	}

	return nil
}

CreateDB uses Beego’s orm.RunSyncdb to create the Wine table, additional information is provided in the Generate Tables section of the doc. LoadDb inserts some sample rows into the Wine table.

Controller for wine.go CRUD operations

package controllers

import (
	"encoding/json"
	"github.com/astaxie/beego"
	"github.com/mjd/bee-api-gs/models"
	"strconv"
)

// Operations about Wine
type WineController struct {
	beego.Controller
}

// @Title CreateWine
// @Description Add a new wine
// @Param	body		body 	models.Wine	true		"body for user content"
// @Success 200 {int} models.Wine.Id
// @Failure 403 body is empty
// @router / [post]
func (u *WineController) Post() {
	var wine models.Wine
	json.Unmarshal(u.Ctx.Input.RequestBody, &wine)
	uu, err := models.AddWine(wine)
	if err != nil {
		// handle error
		u.Data["json"] = err.Error()
	} else {
		u.Data["json"] = uu
	}

	u.ServeJSON()
}

// @Title GetAll
// @Description get all Wines
// @Success 200 {object} models.Wine
// @router / [get]
func (u *WineController) GetAllWines() {
	wines, err := models.GetAllWines()
	if err != nil {

	}

	u.Data["json"] = wines
	u.ServeJSON()
}

// @Title Get
// @Description get wine by uid
// @Param	uid		path 	string	true		"The key for staticblock"
// @Success 200 {object} models.Wine
// @Failure 403 :uid is empty
// @router /:uid [get]
func (u *WineController) Get() {
	uid := u.GetString(":uid")
	if uid != "" {
		i, err := strconv.Atoi(uid)
		if err != nil {
			u.Data["json"] = err.Error()
		} else {
			wine, err := models.GetWine(i)
			if err != nil {
				u.Data["json"] = err.Error()
			} else {
				u.Data["json"] = wine
			}
		}
	}
	u.ServeJSON()
}

// @Title Update
// @Description update the wine
// @Param	uid		path 	string	true		"The uid you want to update"
// @Param	body		body 	models.Wine	true		"body for user content"
// @Success 200 {object} models.Wine
// @Failure 403 :uid is not int
// @router /:uid [put]
func (u *WineController) Put() {
	uid := u.GetString(":uid")
	if uid != "" {
		var wine models.Wine
		json.Unmarshal(u.Ctx.Input.RequestBody, &wine)
		uu, err := models.UpdateWine(uid, wine)
		if err != nil {
			u.Data["json"] = err.Error()
		} else {
			u.Data["json"] = uu
		}
	}
	u.ServeJSON()
}

// @Title Delete
// @Description delete the wine
// @Param	uid		path 	string	true		"The uid you want to delete"
// @Success 200 {string} delete success!
// @Failure 403 uid is empty
// @router /:uid [delete]
func (u *WineController) Delete() {
	uid := u.GetString(":uid")
	i, err := strconv.Atoi(uid)
	if err != nil {
		u.Data["json"] = err.Error()
	} else {
		models.DeleteWine(i)
		u.Data["json"] = "delete success!"
		u.ServeJSON()
	}
}


The wine controller is invoked by the router when it finds /v1/wine in the URI. Each operation is commented so we an generate Swagger documentation for our API specification. Otherwise the code is fairly simple and straight forward. Each function invokes an operation on the Wine model to perform the CRUD operation. The JSON results are returned to the client.

The Wine model

package models

import (
	"github.com/astaxie/beego/orm"
	"strconv"
	"time"
)

// Marshal Wine model to ORM
type Wine struct {
	Id int    		`orm:"auto"`
	Product string		`orm:"size(64)"`
	Description string	`orm:"size(128)"`
	Price float32		`orm:"null"`
	CreatedAt  time.Time    `orm:"auto_now_add;type(datetime)"`
	UpdatedAt  time.Time    `orm:"auto_now;type(datetime);null"`
}

func GetAllWines() ([]*Wine, error) {

	o := orm.NewOrm()

	var wines []*Wine
	qs := o.QueryTable("wine")
	_, err := qs.OrderBy("Id").All(&wines)

	if err != nil {
		return nil, err
	}

	return wines, nil
}

func GetWine(id int) (*Wine, error) {

	o := orm.NewOrm()

	// Fetch wine by Id
	wine := Wine{Id: id}
	err := o.Read(&wine)
	if err != nil {
		return nil, err
	}

	return &wine, nil
}

func AddWine(wine Wine) (*Wine, error) {

	o := orm.NewOrm()

	id, err := o.Insert(&wine)
	if err != nil {
		return nil, err
	}

	return GetWine(int(id))
}

func UpdateWine(uid string, wine Wine) (*Wine, error) {

	o := orm.NewOrm()

	// Assign Id to update
	id, err := strconv.Atoi(uid)
	if err != nil {
		return nil, err
	}
	wine.Id = id

	var fields []string

	// Update changed fields
	if wine.Description != "" {
		fields = append(fields, "Description")
	}

	if wine.Product != "" {
		fields = append(fields, "Product")
	}

	if wine.Price != 0.0 {
		fields = append(fields, "Price")
	}

	_, err = o.Update(&wine, fields...)
	if err != nil {
		return nil, err
	}

	// Return JSON for update
	return GetWine(id)
}

func DeleteWine(id int) (*Wine, error) {

	// wine := new(Wine)
	o := orm.NewOrm()

	// Select the object to delete
	wine := Wine{Id: id}
	err := o.Read(&wine)
	if err != nil {
		return nil, err
	}

	// delete
	_, err = o.Delete(&wine)

	return &wine, nil
}

The Wine struct uses ORM hints to prescribe operations or features to be be applied to our database columns, details can be found in the Set parameters section of the Beego doc.

  1. GetAllWines – returns all rows orderd by Id
  2. GetWine -return wine for the Id passed in
  3. UpdateWine – creates a slice of changes, passed to Update as a variadic parameter
  4. DeleteWine – completed the CRUD lifecycle

On to the fun part, sending some JSON messages and see what comes back!

We’ll be using HttpIe in our examples, but if you prefer curl please see the Swagger doc references.

# set the secret
$ export secret='aaaaBBBB1234&^%$'
# run beego app
$ bee run -downdoc=true -gendoc=true

# find swagger apidoc here: http://127.0.0.1:8080/swagger/

Get all rows

$ http :8080/v1/wine

HTTP/1.1 200 OK
Content-Length: 954
Content-Type: application/json; charset=utf-8
Date: Fri, 19 Jun 2020 21:12:46 GMT
Server: beegoServer:1.12.1

[
    {
        "CreatedAt": "2020-06-19T21:06:44.691086Z",
        "Description": "Old vine Cabernet Sauvignon",
        "Id": 1,
        "Price": 159.99,
        "Product": "SOMMELIER SELECT",
        "UpdatedAt": "2020-06-19T21:06:44.691086Z"
    },
    {
        "CreatedAt": "2020-06-19T21:06:44.695087Z",
        "Description": "Pinot Noir captures luscious aromas",
        "Id": 2,
        "Price": 89.99,
        "Product": "MASTER VINTNER",
        "UpdatedAt": "2020-06-19T21:06:44.695087Z"
    },
    {
        "CreatedAt": "2020-06-19T21:06:44.697086Z",
        "Description": "Merlot featuring complex flavors of cherry",
        "Id": 3,
        "Price": 84.99,
        "Product": "WINEMAKER'S RESERVE",
        "UpdatedAt": "2020-06-19T21:06:44.697086Z"
    },
    {
        "CreatedAt": "2020-06-19T21:06:44.700086Z",
        "Description": "Sangiovese grape is famous for its dry, bright cherry character",
        "Id": 4,
        "Price": 147.99,
        "Product": "ITALIAN SANGIOVESE",
        "UpdatedAt": "2020-06-19T21:06:44.701087Z"
    }
]

Get wine by Id

# wine by Id
$ http :8080/v1/wine/2

HTTP/1.1 200 OK
Content-Length: 210
Content-Type: application/json; charset=utf-8
Date: Fri, 19 Jun 2020 21:13:57 GMT
Server: beegoServer:1.12.1

{
    "CreatedAt": "2020-06-19T21:06:44.695087Z",
    "Description": "Pinot Noir captures luscious aromas",
    "Id": 2,
    "Price": 89.99,
    "Product": "MASTER VINTNER",
    "UpdatedAt": "2020-06-19T21:06:44.695087Z"
}

Add a new wine to the collection

# POST a new wine
$ http POST :8080/v1/wine Price:=42.24 Product="Fat Bastard" Description="Intense, cherry red in color with fruit-forward flavors of crushed strawberry and wild raspberry"

HTTP/1.1 200 OK
Content-Length: 268
Content-Type: application/json; charset=utf-8
Date: Fri, 19 Jun 2020 21:16:42 GMT
Server: beegoServer:1.12.1

{
    "CreatedAt": "2020-06-19T21:16:42.141532Z",
    "Description": "Intense, cherry red in color with fruit-forward flavors of crushed strawberry and wild raspberry",
    "Id": 5,
    "Price": 42.24,
    "Product": "Fat Bastard",
    "UpdatedAt": "2020-06-19T21:16:42.141532Z"
}

Update a row

# PUT an update
$ http PUT :8080/v1/wine/5 Price:=84.48 Product="Fetid Cow"

HTTP/1.1 200 OK
Content-Length: 266
Content-Type: application/json; charset=utf-8
Date: Fri, 19 Jun 2020 21:18:44 GMT
Server: beegoServer:1.12.1

{
    "CreatedAt": "2020-06-19T21:16:42.141532Z",
    "Description": "Intense, cherry red in color with fruit-forward flavors of crushed strawberry and wild raspberry",
    "Id": 5,
    "Price": 84.48,
    "Product": "Fetid Cow",
    "UpdatedAt": "2020-06-19T21:18:44.644836Z"
}

Delete a row

# Delete row
$ http DELETE :8080/v1/wine/5 

HTTP/1.1 200 OK
Content-Length: 17
Content-Type: application/json; charset=utf-8
Date: Fri, 19 Jun 2020 21:20:04 GMT
Server: beegoServer:1.12.1

"delete success!"
Happy Bee mascot
One Happy Bee

In summary

  • We refactored our earlier basic CLI API project to include a new API
  • Properties, including secrets are stored in YAML
  • New API persists data using Beego ORM
  • Our API is documented for the world using Swagger

All of this goodness in just a few hours of work, but all this talk of wine has made me thirsty, cheers!

Get going with Beego Framework

An open source framework inspired by Tornado, Sinatra and Flask for building web applications using idiomatic Go

Rationale – Do we really need another web framework?

I ask myself this question every time i’m lured by the next bright and shiny thing which comes along. There’s going to be some effort which goes into the learning curve and in the end, the payback should be substantially more than the upfront investment. Here’s some of the issues I consider when determining whether to commit to learning some new framework or technology:

  • A framework in general should give you a boost in velocity for getting important work done.
  • Good frameworks put the scaffolding in place needed to solve complex patterns.
  • They get out of the way, allowing you to focus on the business logic needed for your solution.
  • Good frameworks should be secure and extensible.
  • There should be vibrant community support, ongoing activity and adoption by projects.

With these top level goals in mind, lets see if the Beego Framework can get you up and running quickly and have some fun at the same time.

Happy Bee mascot

Prerequisites

You’ll need to have Go installed and GOPATH configured so you can build and install Go applications and packages. If you’re not sure how to do this and wish to continue, start here.

Installation

Run these commands to install the Beego framework and the Command Line Interface (CLI) project tool.

# Install Beego framework
$ go get github.com/astaxie/beego

# Install the CLI
$ go get github.com/beego/bee

We’re going to create a web application in Go using the Beego Framework. To give you an idea of the simplicity of creating a web application in Beego, we’ll create a site using one line of code in the main function.

Spoiler alert

Here’s the page you’ll get when you browse the website. Although you’ll get a 404 not found error when you visit the home page, the web site is up and running and you connected to it, it just doesn’t have home page (yet).

http://localhost:8080
Beego default page
Beego default home page

Hope this spoiler alert didn’t ruin the fun. Let’s take a look now at the code you’ll need to create this simple site. Create the main.go application below and run the application using the command shown in the comments below.

Default website using Beego Framework

// Filename: main.go
// Run: go run main.go

package main

import "github.com/astaxie/beego"

func main() {
	beego.Run()
}

With the demonstration of a simple web application creation completed, lets explore the Beego Framework a little deeper. If you’re familiar with the Model View Controller (MVC) web pattern than you probably have enough background to get started with Beego. The main event loop waits for connections and hands off eachroute requests to the controller which may interact with an ORM. Views are rendered by a template engine are returned to the requester.

Rendered views can be HTML pages or JSON payloads. Beego may be responding as a Web Server or acting in the role of a high performance API server. Using the CLI we installed earlier, lets generate a new project and see how it differs from our first website example.

Create a new project with the bee CLI

# windows: cd %GOPATH%\src\github.com\mjd
#   linux: cd $GOPATH/src/github.com/mjd
# Create a new web project, i'll be using my project src tree, change this for yours
$ bee new bee-web-gs

The CLI will generate a number of default folders to help you get started. There will be top level folders for models, views and controllers as well as folders for routes, configuration and web support.

Folder structure created by bee CLI

myproject
├── conf
│   └── app.conf
├── controllers
│   └── default.go
├── main.go
├── models
├── routers
│   └── router.go
├── static
│   ├── css
│   ├── img
│   └── js
├── tests
│   └── default_test.go
└── views
    └── index.tpl

You can also use the CLI to run the project, when you do it will watch for changes you make and reload the website automatically.

Note: when I tried running the code above generated by the CLI I got the same 404 error we saw earlier. To resolve it, I had to tell the main function where to find the router config, see sample below.

package main

// added import below for beego to find router
//   _ "github.com/mjd/bee-web-gs/routers"
import (
	_ "github.com/mjd/bee-web-gs/routers"
	"github.com/astaxie/beego"
)

func main() {
	beego.Run()
}

Run the generated code

# run using the CLI
$ bee run

# view home page in the browser
http://localhost:8080/

This time when you browse to the home page you should see the welcome banner below. The basic project scaffolding has created a route for you to reach the controller and renders an HTML view from a Go template file which is returned to the browser. The hooks are in place for interacting with a backend data model, but those decisions are left for you.

Happy Bee
Successful home page route

To add an additional route which handles separate concerns, you would create a new controller and reference the controller from the router. In the example below we’ll reuse the example index.tpm and override to template parameters with our own. In the real world, you might instead create a Single Page Application (SPA), but that process would lead us down a completely different path, instead we’ll constrain our focus.

Adding a new controller

// Adding a new Controller to handle routes to /foo
// controllers/foo.go
package controllers

import (
	"github.com/astaxie/beego"
)

type FooController struct {
	beego.Controller
}

func (c *FooController) Get() {
	print("Invoke Foo controller")
	c.Data["Website"] = "Bestow.info"
	c.Data["Email"] = "support@Bestow.info"
	c.TplName = "index.tpl"
}

We would bind to our new controller by adding it’s reference to the router.go file.

Adding Router binding

// routes/router.go

// snippet shows addition of reference to foo controller in init()
func init() {
    beego.Router("/", &controllers.MainController{})
    beego.Router("/foo", &controllers.FooController{})
}

With the new route in place you can browse to /foo and see the new properties rendered at the bottom of the page, that we injected into the index.tpl file.

One area where Beego stands out from other frameworks is with it’s out of the box support for dashboard analytics. You can enable an Admin dashboard by adding these parameters to the app.conf file.

# enable admin dashboard in conf/app.conf
EnableAdmin = true
AdminAddr = "localhost"
AdminPort = 8088

When the server restarts you’ll see the Admin server running on the AdminPort number you configured above. When you browse to the Admin server you’ll be able to review Health Check and other vital stats for the running server.

Browse to Admin dashboard

http://localhost:8088/qps

API Scaffolding

Create a new API project with Beego CLI

Lets create a new Beego scaffolding for an API project. Change your directory to a location you would like the new project created in and use the CLI to create the project artifacts.

# create a new API project
$ bee api bee-api-gs

# change into the project folder and run the project
$ cd bee-api-gs
$ bee run

Like with the earlier Web project, the folder structure will be similar, but with no need for the static and views folders.

With the project running you can start playing with it by sending JSON REST commands. You can use curl if you like, I prefer httpie and will show a few interactions below.

API GET Request

# Start with a GET request
$ http :8080/v1/user
HTTP/1.1 200 OK
Content-Length: 230
Content-Type: application/json; charset=utf-8
Date: Thu, 30 Apr 2020 21:23:46 GMT
Server: beegoServer:1.12.1

{
    "user_11111": {
        "Id": "user_11111",
        "Password": "11111",
        "Profile": {
            "Address": "Singapore",
            "Age": 20,
            "Email": "astaxie@gmail.com",
            "Gender": "male"
        },
        "Username": "astaxie"
    }
}

API PUT Request

# now change the passsword
$ http PUT :8080/v1/user/user_11111 Password="24689"
HTTP/1.1 200 OK
Content-Length: 190
Content-Type: application/json; charset=utf-8
Date: Thu, 30 Apr 2020 22:34:17 GMT
Server: beegoServer:1.12.1

{
    "Id": "user_11111",
    "Password": "24689",
    "Profile": {
        "Address": "Singapore",
        "Age": 20,
        "Email": "astaxie@gmail.com",
        "Gender": "male"
    },
    "Username": "astaxie"
}

API POST Request

# Create new user
$ http POST :8080/v1/user Id=user_1357 Password="24689" Username=Foo
HTTP/1.1 200 OK
Content-Length: 39
Content-Type: application/json; charset=utf-8
Date: Thu, 30 Apr 2020 22:36:29 GMT
Server: beegoServer:1.12.1

{
    "uid": "user_1588286189531666600"
}

# GET user by ID
$ http :8080/v1/user/user_1588286189531666600
HTTP/1.1 200 OK
Content-Length: 169
Content-Type: application/json; charset=utf-8
Date: Thu, 30 Apr 2020 22:37:38 GMT
Server: beegoServer:1.12.1

{
    "Id": "user_1588286189531666600",
    "Password": "24689",
    "Profile": {
        "Address": "",
        "Age": 0,
        "Email": "",
        "Gender": ""
    },
    "Username": "Foo"
}

API DELETE Request

# Delete by ID
$ http DELETE :8080/v1/user/user_1588286189531666600
HTTP/1.1 200 OK
Content-Length: 17
Content-Type: application/json; charset=utf-8
Date: Thu, 30 Apr 2020 22:39:06 GMT
Server: beegoServer:1.12.1

"delete success!"

There we have it, a fairly complete API scaffold with very little work on our part.

Next lets generate and view Swagger doc for the API’s we created.

Swagger DOC

# Pass parameters to generate swagger doc
$ bee run -downdoc=true -gendoc=true

# To view swagger doc browse to:
http://localhost:8080/swagger/

Extensions

The following middleware extensions are available for Beego

Community Support

As of this post, there appears to be fairly regular commit’s to the Beego repository, over 3500 to date by about 300 contributors and the repo is trending toward 24K stars.

Due to it’s high performance, clean code and ease of use there seems to be a growing interest to integrate the framework into cloud applications. A recent one which I reviewed is the CCNF Harbor Project.

Strong community interest is a good sign that a project may be around for a while and worth your consideration and investment.

Summary

With the Beego Framework we’re able to rapidly create the scaffolding needed to build serious Web and REST API applications. The framework is built using Go, a relatively new language which is easy to learn and was built to solve common problems encountered in Cloud Computing. The scaffolding comes with built a built in analytics dashboard to give you insights into operations. It’s an active project and seems to have an enthusiastic community and growing project support.

References

A safe Harbor for Kubernetes

Harbor is an open source trusted cloud native registry project that stores, signs, and scans content.

Executive Summary

Harbor is an incubating project in the Cloud Native Computing Foundation (CNCF). Harbor extends the open source Docker Distribution by adding the capabilities necessary for organizations such as: security, identity and management.

  • Security and vulnerability analysis
  • Automation accounts which support CI/CD
  • Image replication across multiple registries
  • OpenID connect for simple identity management
  • API performance monitoring and Health Checks
  • Over 11,500 stars on GitHub

Benefits to your organization

Harbor is a cloud native registry providing support for both container images and Helm charts. Granular access control grants or restricts user access to different repositories at the project level. A user can have different permission for images or Helm charts within a project.

Harbor system architecture
Harbor service architecture for Kubernetes and Docker container management

Container images and Helm charts can be replicated (synchronized) between multiple registry instances based on policies. The policies can be filtered using tags and labels. If an error occurs during replication, harbor will automatically retry. To ensure your container images are free from known Common Vulnerabilities and Exposures (CVE’s), Harbor performs container image scans regularly and supports policy checks to prevent vulnerable images from being deployed.

Harbor leverages OpenID Connect (OIDC), a simple identity layer on top of the OAuth 2.0 protocol to verify the identity of users authenticated by an external authorization server or identity provider. Single sign-on can be can be supported for users logging into the Harbor portal. Harbor provides support for existing enterprise LDAP/AD for user authentication and management, and supports importing LDAP groups into Harbor granting permissions to specific projects.

To support container images signing Harbor integrates Notary for managing trusted collections of content. Publishers can digitally sign collections and consumers can verify integrity and origin of content.

Using the Harbor user portal, user can easily browse, search repositories and manage projects. All of the site operations to the repositories are audited and tracked through logs. Administrators can interact with the portal using REST API’s, the API definitions can be found in the Swagger Doc here.

Harbor containers can be can be easily deployed using into your Kubernetes cluster using Helm Charts or with Docker Compose.

Conclusion

Harbor is well along the maturity curve in becoming a graduated CNCF project, the recent Oct 2019 pentest concluded that the number of findings were very low, the overall results and general impression of the codebase were positive.

The capabilities gained by using an Open Source solution such as Harbor for: container security scanning, role base management, monitoring, auditing and logging can be a big win for your organization. Earlier adopters will be better positioned as inevitable product hardening and maturity is realized.

Reference information

Consolidate your terminals using TMux

Creating awesome dashboards within a TMux session

A terminal multiplexer allows you to control a number of terminal sessions to other hosts from within a single screen. It’s also able to preserve session state in case you happen to lose your connection to the host. You simply reconnect to your session and everything remains just as you left it. It’s pretty amazing!

In this article, we’ll take a look at some of the capabilities in tmux to help you get up and running quickly, or to give you a chance to kick the tires to see if you find it suitable to your work habits. I’ll be using a small lab or Raspberry Pi’s that we setup in an earlier post: moving Kubernetes closer to the bare metal. Feel free to recreate that lab if you like, or just follow along. I think you’ll be able to get the gist of tmux capabilities simply by following along.

Depending on the flavor of Linux you’re running on the package manager may vary.

The Raspian OS is based on a Debian release and we’ll be using apt. You may need to replace this with dnf, yum, brew, pacman or another package manager depending on your Linux flavor.

Installing tmux on Raspian

# install tmux on raspian
$ sudo apt install tmux
...
Setting up libutempter0:armhf (1.1.6-3) ...
Setting up tmux (2.8-3) ...
Processing triggers for man-db (2.8.5-2) ...
Processing triggers for libc-bin (2.28-10+rpi1) ...

# verify install
$ which tmux
/usr/bin/tmux

$ tmux list-keys
... lots of key bindings

The screen will display lots of key bindings. You can override the defaults for these binding as well as other default tmux behaviors. Enter the desired changes into ~/.tmux.conf to override defaults. We’ll explore some common overrides later in this article.

With tmux installed let’s go through some basic commands. 

Start tmux with a session name

# name our sessions in case we need to resume it later
$ tmux new -s gs-tmux

We provided a session name to aid us if we need to recover from an error and readily find the session we would like to resume.

Initial TMux session
Initial tmux session showing shells, hostname and current datetime

The initial display looks like a standard shell with a green status bar showing:

  1. Session Name
  2. Pseudo terminal namd
  3. Hostname
  4. Datetime

To interact with TMux you’ll enter a HotKey followed by a command. The default command key is Control-b, for which i’ll be using the shortcut form ^b.  We’ll begin by creating 3 new shells by typing ^bc for a total of 3. You’ll notice in the status bar that you now have 3 shells.

Basic navigation exercises

# Create 3 shells
$ ^Bc
$ ^Bc
$ ^Bc

# status bar shows 3 bash shells

# Using ^Bn and ^Bp to advance to the next shell and prior
$ ls
$ ^bn
$ top
$ ^bn
$ echo "shell 3"
$ ^bp
$ ^bp

# Navigate using shell number with ^B[0..n]
$ ^b2
$ ^b1      # kill the top command with ^c

# to delete a shell use ^d
$ ^b2
$ ^d

# keep navigating back and forward until you get bored

Return to the first shell and lets rename the shell and create some panes.

# starting at shell-0 change the name to Control Plane
# using ^b,  backspace to clear old name, enter new name
$ ^b,
Control Plane
$^bn

# repeat for shell-1 and shell-2, using names: Worker1 and Worker2
# if you deleted and shells create with ^bn
$ ^b,
Worker1
$ ^bn
$ ^b,
Worker2

# return to shell-0 and create some panes
# create a row pane with ^b"
# create a column pane with ^b%
$ ^b"
$ ^b%

# navigate your panes using ^b and the arrow keys

# you can zoom in and out of a pane with ^bz

If you’re still with me you should have a tmux session that looks like the picture below.

kubertetes tmux display
Dashboard view of K3s pods, performance and messaging

Note that the status bar now shows a more descriptive name for each shell. The Control Plane shell has 3 panes looking at 3 different views is the system. I hope you are getting a sense for the powerful dashboards you can create using TMux. In this session I went back to the demo lab we created for the project moving Kubernetes closer to the bare metal and am watching the performance using gotop while sending a JSON message to check the health of a custom POD we deployed.

Now lets simulate a fault by closing the shell.

Reconnect to our prior session

# log back into the host that was running your tmux session
#   list sessions
$ tmux list-sessions
gs-tmux: 3 windows (created Tue Apr 21 12:30:19 2020) [111x26]

# reattach to session
$ tmux attach-session -t gs-tmux

You should now have your session back as you last left it.

We’ve just scratched the surface on what you can do in tmux, but I hope it’s enough to whet your whistle and encourage you to dig in further. Before we leave you might consider playing with the .tmux.conf file to override some default settings. Here’s a few to get you started.

Some basic tmux default overrides

# reload configuration
bind r source-file ~/.tmux.conf \; display '~/.tmux.conf sourced'

# change history depth
set -g history-limit 50000

# begin shell numbering at 1 instead of 0
set -g base-index 1

# use ^a instead of ^b as HotKey
set-option -g prefix C-a
unbind-key C-a
bind-key C-a send-prefix

I hope you enjoyed this post and find tmux useful in your daily activities.

Some assembly required

Building stuff on larger, more capable machines, that will eventually run in smaller more constrained environments

Statement of intent

As a hobbyist and tinkerer I would like to be able to assemble containers which, at the press of a button, can be run on a multitude of different target platforms.

Reifying the intent

My build box is a Windows 10 laptop running Docker desktop version 19.03.8. Docker version 19.03 is a significant release, in particular, this release includes buildx, an experimental feature. If you google for: “docker buildx arm”, you’ll learn that about a year ago Docker and Arm announced a business relationship, whereby Docker the company would provide a new capability using the BuildKit engine, for creating cross platform images that would run on Arm and other Linux machines.

How convenient is that?!

In this post we’ll be using the experimental buildx option, through the docker cli, to leverage BuildKit to create a container image which will deploy to and run in a Raspberry Pi4 Kubernetes cluster. There’s a lot of behind the scenes details which you’ll probably want to know, which is why I mentioned the earlier google search terms. In the space below we will focus on getting it done, rather than understanding how does it work. How it works has been described numerous times already.’

To get us started we’ll be using a project that we worked with earlier in a Simple micro service in Go. If you haven’t done so already go ahead and download it into your Go source folder. There’s some minor changes that i’ve added to the project, there’s now another file called Dockerfile-linux which I use locally to build and deploy to my Docker Hub account.

New multi architecture Dockerfile-linux

FROM golang
ARG TARGETPLATFORM
ARG BUILDPLATFORM
# Add some extra debug to the output
RUN echo "Building on $BUILDPLATFORM, for $TARGETPLATFORM"

ADD . /go/src/github.com/mjd/basic-svc

# Build our app for Linux - CGO_ENABLED=0 GOOS=linux GOARCH=arm GOARM=7 arm32v7
RUN go install github.com/mjd/basic-svc && rm -rf /go/src

# Run the basic-svc command by default when the container starts.
ENTRYPOINT /go/bin/basic-svc

# Document that the service listens on port 8083
EXPOSE 8083

TARGETPLATFORM and BUILDPLATFORM are referenced during the build to aid with debugging. With Docker desktop v19.03 installed, you should enable the experimental feature, restart the Docker Engine and verify that buildx is working.

# verify buildx by lsiting the default builder
$ docker buildx ls

NAME/NODE  DRIVER/ENDPOINT   STATUS  PLATFORMS
default    docker
  default  default           running linux/amd64, linux/arm64, linux/ppc64le, 
                             linux/s390x, linux/386, linux/arm/v7, linux/arm/v6

The legacy default builder won’t be able to create images for the platforms we’re interested in, so instead we’ll create a new builder which will.

# Create a new builder, capable of building images for our targets
$ docker buildx create --name nix-arm
nix-arm

# list the builders again and we see newly created nix-arm
docker buildx ls
NAME/NODE  DRIVER/ENDPOINT   STATUS  PLATFORMS
nix-arm    docker-container
  nix-arm0 npipe:////./pipe/docker_engine 
                             running linux/amd64, linux/arm64, linux/ppc64le, 
                             linux/s390x, linux/386, linux/arm/v7, linux/arm/v6
default *  docker
  default  default                        
                             running linux/amd64, linux/arm64, linux/ppc64le, 
                             linux/s390x, linux/386, linux/arm/v7, linux/arm/v6

To make use of a specific builder, we use it. In the code below we use our new builder and also run the inspect command on it.

# Let docker cli know which builder to use
$ docker buildx use nix-arm

$ docker buildx inspect
Name:   nix-arm
Driver: docker-container

Nodes:
Name:      nix-arm0
Endpoint:  npipe:////./pipe/docker_engine
Status:    running
Platforms: linux/amd64, linux/arm64, linux/ppc64le, 
           linux/s390x, linux/386, linux/arm/v7, linux/arm/v6

With our builder created and set we can now run the build, which will push images for each target platform to Docker Hub. Be sure to change my Docker Hub location (-t mitchd/basic-svc-linux) to yours.

# create images for multiple platforms and push images to Docker Hub
$ docker buildx build --platform linux/amd64,linux/arm64,linux/arm/v7 \
         --push -t mitchd/basic-svc-linux -f Dockerfile-linux  .

# lots of image pulls and intermediate results 
  ...
                                   1.1s
 => [linux/arm64 3/4] ADD . /go/src/github.com/mjd/basic-svc                                                       0.0s
 => [linux/arm64 4/4] RUN go install github.com/mjd/basic-svc && rm -rf /go/src                                    6.1s
 => exporting to image                                                                                            11.3s
 => => exporting layers                                                                                            4.1s
 => => exporting manifest sha256:d22bb66f31f9bf57f1252f5b770219808c428638ba823e12d481f55a2e600120                  0.0s
 => => exporting config sha256:ce463347999a38dcc25295bd455de4aaf19290dd987f2c77cb6d3a1a02b77826                    0.0s
 => => exporting manifest sha256:c8b84bbefccb992743a3dde2a453c483941b1b16c45fdf2b5a062382f83dcc3a                  0.0s
 => => exporting config sha256:ea56a06d8afc774db80207608c55dd1de5d09de3c7e0194fd32bf2af8a1c5788                    0.0s
 => => exporting manifest sha256:e7ef6fc6118ffd0163cff3e40e53228ca13142f434e02d3bb143835d70e82074                  0.0s
 => => exporting config sha256:f469c4777fe897ffdd386922110efa84d13a8d2e3b58bf5f1f0b376ce69547d7                    0.0s
 => => exporting manifest list sha256:d02d8d6ee6a6cbce49653490a7b16f38468d5647f0f26bd9ebe94d28267c6e4b             0.0s
 => => pushing layers                                                                                              5.7s
 => => pushing manifest for docker.io/mitchd/basic-svc-linux:latest

Verify that the images were created for the correct target using imagetools inspect.

# create image for generic linux
docker buildx imagetools inspect mitchd/basic-svc-linux:latest
Name:      docker.io/mitchd/basic-svc-linux:latest
MediaType: application/vnd.docker.distribution.manifest.list.v2+json
Digest:    sha256:d02d8d6ee6a6cbce49653490a7b16f38468d5647f0f26bd9ebe94d28267c6e4b

Manifests:
  Name:      docker.io/mitchd/basic-svc-linux:latest@sha256:d22bb66f31f9bf57f1252f5b770219808c428638ba823e12d481f55a2e600120
  MediaType: application/vnd.docker.distribution.manifest.v2+json
  Platform:  linux/amd64

  Name:      docker.io/mitchd/basic-svc-linux:latest@sha256:c8b84bbefccb992743a3dde2a453c483941b1b16c45fdf2b5a062382f83dcc3a
  MediaType: application/vnd.docker.distribution.manifest.v2+json
  Platform:  linux/arm64

  Name:      docker.io/mitchd/basic-svc-linux:latest@sha256:e7ef6fc6118ffd0163cff3e40e53228ca13142f434e02d3bb143835d70e82074
  MediaType: application/vnd.docker.distribution.manifest.v2+json
  Platform:  linux/arm/v7

With our Raspberry Pi 4 image created and deployed into Docker Hub, lets see if we can push it out to the Kubernetes cluster we created in my post: moving Kubernetes closer to the bare metal. As we continue in this example we’re going create a pod, service and gateway using our earlier Rancher K3S Kubernetes cluster from the link to the post above.

Copy to: deploy-basic-svc.yamlto create our service, gateway and pod

apiVersion: apps/v1
kind: Deployment
metadata:
  name: basic-svc
  labels:
    app: basic-svc
spec:
  replicas: 1
  selector:
    matchLabels:
      app: basic-svc
  template:
    metadata:
      labels:
        app: basic-svc
    spec:
      containers:
      - name: basic-svc-armv7
        image: mitchd/basic-svc-linux
        ports:
        - containerPort: 8083
---
apiVersion: v1
kind: Service
metadata:
  name: demo-service
spec:
  selector:
    app: basic-svc
  ports:
    - protocol: TCP
      port: 80
      targetPort: 8083
---
apiVersion: networking.k8s.io/v1beta1
kind: Ingress
metadata:
  name: basic-svc-ingress
  annotations:
    kubernetes.io/ingress.class: "traefik"
spec:
  rules:
  - http:
      paths:
      - path: /
        backend:
          serviceName: demo-service
          servicePort: 80

In the snippet below we’ll set a watch using a shell on the K3S server to verify our components are created.

$ sudo watch kubectl get all

In another shell we’ll run the yaml file we created above to deploy our pod and make it accessible to the outside. It may take a few minutes to download the basic-svc from Docker Hub and deploy it to a container in our K3S cluster, so be patient.

# Apply the basic-svc yaml
$ sudo kubectl apply -f deploy-basic-svc.yaml

In the shell running the watch command, you should see the gateway, service and pod being deployed into the K3S cluster.

Every 2.0s: kubectl get all                           viper: Sun Apr 12 19:22:34 2020
NAME                               READY   STATUS    RESTARTS   AGE
pod/basic-svc-7bc858fb89-59sfg     1/1     Running   0          3h33m

NAME                    TYPE        CLUSTER-IP      EXTERNAL-IP   PORT(S)   AGE
service/kubernetes      ClusterIP   10.43.0.1       <none>        443/TCP   9d
service/demo-service    ClusterIP   10.43.143.187   <none>        80/TCP    3h33m

NAME                          READY   UP-TO-DATE   AVAILABLE   AGE
deployment.apps/basic-svc     1/1     1            1           3h33m

NAME                                     DESIRED   CURRENT   READY   AGE
replicaset.apps/basic-svc-7bc858fb89     1         1         1       3h33m

Testing our pod

# using httpie connect to the IP address for your service, mine is 10.43.143.187
# using curl: curl http://10.43.143.187/health
$ http 10.43.143.187/health

HTTP/1.1 200 OK
Content-Length: 65
Content-Type: application/json
Date: Sun, 12 Apr 2020 23:31:58 GMT

{
    "Hostname": "basic-svc-7bc858fb89-59sfg",
    "IpAddress": "10.42.2.9"
}

Cleanup

# To remove our demo code
$ sudo kubectl delete -f deploy-basic-svc.yaml

In my basic-svc git repository i’ve added a Helm Chart which deploys the basic service as we just did above. Be sure to do a pull request if you have an older repository downloaded.

You might recall that one of the last steps we performed when we installed k3s in moving Kubernetes closer to bare metal, was to install Helm. In that process we didn’t exercise Helm so i’ve included some basic getting started steps below.

Using Helm to Deploy basic-svc

# pass k3s cluster config to helm
$ sudo helm install demo-svc . --kubeconfig /etc/rancher/k3s/k3s.yaml

# send a json request to the service as we did before
$ http 10.43.166.150/health

HTTP/1.1 200 OK
Content-Length: 66
Content-Type: application/json
Date: Mon, 13 Apr 2020 11:27:29 GMT

{
    "Hostname": "basic-svc-7bc858fb89-mkkqp",
    "IpAddress": "10.42.2.10"
}

# list
$ sudo helm list --kubeconfig /etc/rancher/k3s/k3s.yaml
NAME       NAMESPACE REVISION  UPDATED  STATUS            CHART           APP VERSION
demo-svc   default   1         2020-04-13 07:26:38.817... basic-svc-0.0.1 1

# cleanup
$ sudo helm uninstall demo-svc --kubeconfig /etc/rancher/k3s/k3s.yaml

We’ve completed a lot. We now have a methodology for docker which can create images for Linux amd64, Amazon EC2 A1 64-bit Arm, Raspberry Pis running armv7 and potentially more. Then we created some yaml and a Helm chart to push our docker container into our K3S cluster. Lastly we interacted with our service pod.

References

Building Multi-Arch Images for Arm and x86 with Docker Desktop

Helm Docs Home

Will it cluster? k3s on your Raspberry Pi

Amazing Ribs

With some basic equipment, a little bit of time and a passion for the very best – anyone can make mouth watering succulent ribs!

We all have our own preference when it comes to the best style of ribs. Some prefer Carolina style or Memphis style or Kansas City, and they’re all good. Having had some time to immerse myself riding the BBQ Trail, the hands down winner for me is Texas style, dry rubbed with a Southwestern medley of the right blend of seasoning, herbs and spices. When I make a rub, i’ll scale up the recipe to get a good 3 – 4 uses from it. Here’s my basic go to dry rub recipe:

Use on Ribs, Chicken, Flank Steak, whatever …

4 Tbs paprika1.3Tbs black pepper
4 Tbs garlic powder1.3 Tbs oregano
3 Tbs kosher salt1 Tbs cayenne
3 Tbs brown sugar1 Tbs coriander
1.3 Tbs sage1 Tbs cumin

The oregano and sage are picked and dried from my wife Diane’s herb garden outside of our front door. If you don’t have your own herb garden the store bought will do.

Ribs dry rub preparation

After removing the meat from the plastic wrapper I like to run it under that faucet to remove any leftover smells from packaging. Next i’ll pat the meat dry with paper towels to remove as much moisture as possible from the surface of the meat. Then it’s time to apply the dry rub. I’ll sprinkle the dry rub on both sides of the meat applying a more generous portion to the meaty side. I apply the rub with a spoon to keep from contaminating unused mix. Using your hands apply the rub to the meat as if you’re applying lotion to your hands.

Weber Chimney
Weber Chimney

Before applying the dry rub I usually load the charcoal into the chimney and light the fire. It can sometimes take 20 minutes for the coals to burn down to hot glowing embers so it’s good to have this task running in parallel.

In the bottom of the chimney i’ll crumple a few pages from the newspaper, not packing too tight, but just enough to catch fire easily when surrounded by pockets of air. I let the chimney rest in our fire-pit while the coals are turning into embers. You’ll need a safe place like this to keep it so to not accidentally catch the back yard on fire. Nothing will irritate first responders more than coming out to extinguish your yard fire, before your delicious ribs have are cooked!

Staging the Smoker

Ready set smoke!
Ready set smoke!

The smoker I use is an moderately priced Dyna Glo with an offset chamber which provides indirect heat. Our goal is to smoke at a temperature that we’ll hold to 225 – 250 degrees F (the thermometer’s ideal region), this technique is commonly referred to as cooking low and slow.

The reason for the lower temperature is to induce a chemical reaction between amino acids in proteins while reducing sugars in the meat. This reaction will cause a browning of the meat known as the Maillard reaction. The slow cooking will lead to a crunchy crust and develop a richness and depth of flavors and texture. I use a long set of tongs for re-positioning the meat as it cooks and to push hot coals into the offset chamber. You want to be extra careful not to touch any of the hot surfaces.

Another thing I do is to add a drip container to the bottom of the chamber. It both helps to keep the floor of the smoker clean and provides additional moisture to the chamber as the food cooks. I fill the drip container about half way with a mixture of water and apple cider vinegar or a fruit juice. It’s up to you how you adjust the percentage of water to juice flavors. You might consider starting simple with 15 – 20% juice to water and increase from there if you would like more of the steamy fruity flavors.

Dyna Glo Smoker
Dyna Glo Smoker with offset chamber

The hot coals from the chimney should be the last thing which goes into the smoker before you close the door. As you can see from the picture I have some wood mulch under my smoker. As you add more coal to the chamber there will be small hot embers which fall to the ground. To ensure that I don’t cause an outside fire, I soak the area beneath the offset chamber with water before the hot coals go in. The last thing I do before the door is close is to add some hardwood chips like: apple, cedar, mesquite or hickory. It won’t take long before you see the smoke billowing out from the smoker. The external thermometer on the door begins to climb into the ideal range. You’ll want to keep a close eye on the temperature and feed to coals to keep the cooking temperature in the ideal region. I’ve found that adding between 10 – 15 briquettes and wood chips on the half hours to be a good average.

At this time you can go into maintenance mode, tending the fire, tending to your guests, enjoying some cold beer if it’s an especially hot day, or just enjoying the beer anyway.

How much smokiness will you need? This is a subjective question, the answer is – it’s going to be however much you like. It might take you a few trial and error runs to figure this out. The next question you’re probably wondering is – when will the ribs be done?

You can’t tell when they’re done just by looking, you’ll need a temperature probe. Good, accurate thermometers can be obtained for less than $20. The USDA recommendation for food safety is 145 degrees F for ribs. Diane prefers wet ribs to dry, so after a rack reaches safe temperature i’ll pull a dry rack for myself and paint the remaining rack with a wet sauce.

The wet rack will go back into the smoker for an additional 20 – 30 minutes or until it begins to caramelize. Keep some of your favorite dipping sauce handy to drizzle over the top of them.

I hope all of this talk about smoking meats has inspired you to get out into you back yard and give it a try.

Bon appétit!

Moving Kubernetes closer to the bare metal

Our earlier Kubernetes examples work well in the Cloud, but can we run minimal HA clusters in smaller footprints or in embedded systems?

Photo by Juan Pablo Serrano Arenas from Pexels
Culinary reduction

In cooking, reduction is the process of thickening and intensifying the flavor of a liquid mixture such as a soup, sauce, wine, or juice by simmering or boiling. In software engineering reduction is a process of: refactoring an application to minimize resource usage so an application can perform well in environments where resources or compute capacity are limited, yet preserving or enhancing core capabilities.

Instead of bringing our kettles to a boil to reduce a sauce, we’ll take a look at an already reduced Kubernetes implementation capable of running in a minimal resource environment, such as an embedded processor. There’s lots of great Kubernetes implementations in the market that you can get started with. My primary goal was to find one that I could experiment with using my Raspberry Pi’s in my mad scientist’s lab. My goal presented some interesting challenges such as:

  • The solution must run on an ARM7 processor
  • It must be able to run in a small memory and resource footprint
  • The runtime services shouldn’t be resource intensive
K3S is distancing from the competition and moving closer toward the sweet spot

The implementation I chose is one which seems to be standing out more and more from the crowd, Rancher K3S.

Recent Forrester research shows Rancher pulling away from the pack when considering their strategic vision and capabilities. Rancher received Forrester’s leader rating based upon it’s: runtime and orchestration, security features, image management, vision and future roadmap.

The most common use case which Rancher is it’s practical application to edge computing environments. Edge computing is a distributed computing paradigm which brings computation and data storage closer to the location where it is needed, to improve response times and save bandwidth.

To create a reduced Kubernetes implementation footprint, Rancher removed etcd and a large part of cloud support, these being the larger heavyweight components of most core Kubernetes implementations. They also replaced Docker with contained and use flannel to create virtual networks that give a subnet to each host for use with container runtimes. In removing etcd, they needed a new mechanism for supporting a distributed key/value store. There are several ways K3S can be configured to support the distributed key/value store and high availability (HA) including:

  • Embedded SQLite DB (not HA)
  • Using a HA RDMBS such as MySQL
  • Embedded HA DQLite (experimental at this time)

In this post we’ll be installing the simpler embedded SQLite in order to focus our time on getting a K3S cluster up and running. In a future post we may explore the more battled hardened implementations.

K3S Server with embedded SQLite

A complete K3S server implementation runs within a single application space. Agent nodes are registered using a websocket connection initiated by the K3S agent process. The connections are maintained by a client-side load balancer which runs as part of the agent process.

Agents register with the server using the node cluster secret along with a randomly generated password for the node. Passwords are stored in /etc/rancher/node/password. The server stores passwords for individual nodes in /var/lib/rancher/k3s/server/cred/node-passwd. Subsequent attempts must use the same password.

Here’s a great introduction to K3S by creator, Chief Architect and Rancher Labs co-founder Darren Shepherd.

We’ll look more at the configurations settings as we get into the installation and configurations, so lets get started. The installation process couldn’t be much simpler. We’ll download and install the latest K3S application, which is a self extracting binary that installs K3S and runs as a Linux service. The size of the binary download weighs in at slightly less than 50MB and the extracted runtime footprint consumes a tad less than 300MB.

Raspberry Pi Cluster

NameTypeNotes
ViperPi 4Server
CobraPi 4Worker
AdderPi 4Worker
Chum Pi 3 Worker
NectarinePi ZeroWorker

Note: To install on Pi3 and Pi Zero I had to run a pre-requisite prior to running the worker install (below) that I didn’t run for the Pi4.

Instructions for this pre-requisite.

The first command sudo iptables -F didn’t work, but the last 3 resolved my initial error: modprobe br_netfilter (code=exited, status=1/FAILURE)

The pre-requisite commands below enabled Pi3 and Pi Zero to join cluster
# Had to run on Pi3 and Pi Zero Workers before running Worker install
# This one didn't work: sudo iptables -F
sudo update-alternatives --set iptables /usr/sbin/iptables-legacy
sudo update-alternatives --set ip6tables /usr/sbin/ip6tables-legacy
sudo reboot

Installing the K3S Server

# Install the k3s latest release
mitch@viper:~ $ curl -sfL https://get.k3s.io | sh -

[INFO] Finding latest release
[INFO] Using v1.17.4+k3s1 as release
[INFO] Downloading hash https://github.com/rancher/k3s/releases/download/v1.17.4+k3s1/sha256sum-arm.txt
[INFO] Downloading binary https://github.com/rancher/k3s/releases/download/v1.17.4+k3s1/k3s-armhf
[INFO] Verifying binary download
[INFO] Installing k3s to /usr/local/bin/k3s
[INFO] Creating /usr/local/bin/kubectl symlink to k3s
[INFO] Creating /usr/local/bin/crictl symlink to k3s
[INFO] Creating /usr/local/bin/ctr symlink to k3s
[INFO] Creating killall script /usr/local/bin/k3s-killall.sh
[INFO] Creating uninstall script /usr/local/bin/k3s-uninstall.sh
[INFO] env: Creating environment file /etc/systemd/system/k3s.service.env
[INFO] systemd: Creating service file /etc/systemd/system/k3s.service
[INFO] systemd: Enabling k3s unit
Created symlink /etc/systemd/system/multi-user.target.wants/k3s.service → /etc/systemd/system/k3s.service.
[INFO] systemd: Starting k3s

# check the status or the k3s server
mitch@viper:~ $ sudo systemctl status k3s

● k3s.service - Lightweight Kubernetes
   Loaded: loaded (/etc/systemd/system/k3s.service; enabled; vendor preset: enabled)
   Active: active (running) since Fri 2020-04-03 10:19:01 EDT; 23h ago
     Docs: https://k3s.io
  Process: 2115 ExecStartPre=/sbin/modprobe br_netfilter (code=exited, status=0/SUCCESS)
  Process: 2118 ExecStartPre=/sbin/modprobe overlay (code=exited, status=0/SUCCESS)
 Main PID: 2119 (k3s-server)
    Tasks: 93
   Memory: 691.0M

# check to see if our node has been created
mitch@viper:~ $ sudo kubectl get nodes

NAME STATUS ROLES AGE VERSION
viper Ready master 48s v1.17.4+k3s1

# lets see what pods we have running
mitch@viper:~ $ sudo kubectl get pods --all-namespaces

NAMESPACE     NAME                                      READY   STATUS      RESTARTS   AGE
kube-system   local-path-provisioner-58fb86bdfd-h5glv   1/1     Running     0          1m
kube-system   metrics-server-6d684c7b5-jx9sh            1/1     Running     0          2m
kube-system   coredns-6c6bb68b64-4qbjb                  1/1     Running     0          2m
kube-system   helm-install-traefik-l8kn7                0/1     Completed   1          2m
kube-system   svclb-traefik-k6dtb                       2/2     Running     0          2m
kube-system   traefik-7b8b884c8-b9cwv                   1/1     Running     0          2m
kube-system   svclb-traefik-k49ct                       2/2     Running     0          2m

# what namespaces have been created
mitch@viper:~ $ sudo kubectl get deployments --all-namespaces

NAMESPACE     NAME                     READY   UP-TO-DATE   AVAILABLE   AGE
kube-system   local-path-provisioner   1/1     1            1           3m
kube-system   metrics-server           1/1     1            1           3m
kube-system   coredns                  1/1     1            1           3m
kube-system   traefik                  1/1     1            1           3m

With our server up and running lets take a look at the performance characteristics. In the gotop snapshot below note that the quad-core CPU’s are barely breathing hard, memory consumption is hovering around 20% and there’s ample room to scale up.

K3S server baseline performance
A snapshot of our K3S baseline performance shows the Kubernetes server is barely breathing hard.

Next we’ll install our worker nodes. When installing K3S it checks for the presence of environment variables: K3S_URL and K3S_TOKEN. When it finds K3S_URL it assumes we’re installing a worker node and uses the K3S_TOKEN value to connect to the cluster. The token can be found on the server in this file: /var/lib/rancher/k3s/server/node-token .

Note: Each machine must have a unique hostname. If your machines do not have unique hostnames, pass the K3S_NODE_NAME environment variable and provide a value with a valid and unique hostname for each node.

Install both of the worker nodes using these commands

# To get the token run this on the Server
mitch@viper:~ $ sudo cat /var/lib/rancher/k3s/server/node-token
K102568cef44c7f67c01f595b8294f2b16bb7e0459907d1703b8ab452c2b72c5514::server:e0c6a36e0bf23ef6631bacde51e1bc65

# install each worker by running the following:
mitch@cobra:~ $ export K3S_URL="https://viper:6443"

mitch@cobra:~ $ export K3S_TOKEN="K102568cef44c7f67c01f595b8294f2b16bb7e0459907d1703b8ab452c2b72c5514::server:e0c6a36e0bf23ef6631bacde51e1bc65"

# install worker
mitch@cobra:~ $ curl -sfL https://get.k3s.io | sh -

# verify the worker status
mitch@cobra:~ $ sudo systemctl status k3s-agent

# from the server, check to see if it discovered the worker
mitch@viper:~ $ sudo kubectl get nodes

NAME    STATUS   ROLES    AGE     VERSION
viper   Ready    master   25h     v1.17.4+k3s1
cobra   Ready    <none>   3m31s   v1.17.4+k3s1

# Repeat these steps for each worker

With our cluster up and running lets deploy an example container.

Deploy an nginx container

mitch@viper:~ $ k3s kubectl run mynginx --image=nginx --port=80

# wait for nginx to complete startup
mitch@viper:~ $ sudo watch kubectl get po
NAME                       READY   STATUS    RESTARTS   AGE
mynginx-7f79686c94-bxb6t   1/1     Running   0          13m

# expose nginx
mitch@viper:~ $ k3s kubectl expose deployment mynginx --port 80

# retrieve endpoint for nginx
mitch@viper:~ $ k3s kubectl get endpoints mynginx
NAME      ENDPOINTS      AGE
mynginx   10.42.2.3:80   30s

# curl the endpoint
mitch@viper:~ $ curl http://10.42.2.3:80

<!DOCTYPE html>
<html>
<head>
<title>Welcome to nginx!</title>
<style>
    body {
        width: 35em;
        margin: 0 auto;
        font-family: Tahoma, Verdana, Arial, sans-serif;
    }
</style>
</head>
<body>
<h1>Welcome to nginx!</h1>
<p>If you see this page, the nginx web server is successfully installed and
working. Further configuration is required.</p>

<p>For online documentation and support please refer to
<a href="http://nginx.org/">nginx.org</a>.<br/>
Commercial support is available at
<a href="http://nginx.com/">nginx.com</a>.</p>

<p><em>Thank you for using nginx.</em></p>
</body>
</html>

To install additional containers you might consider using Helm, the Kubernetes package manager. Helm comes in binary form for your target platform, you can download the latest release here. Be sure to install the ARM version, not the ARM64 version if you’re running on Pi3 or Pi4. While the armhf processor supports 64 bits, versions of Raspian at the time of this writing are compiled to run 32 bit applications. Here’s how you an install Helm.

Installing Helm

# set the version you wish to install
export HELM_VERSION=3.0.2

# download helm and un-tar
wget https://get.helm.sh/helm-v$HELM_VERSION-linux-arm.tar.gz
tar xvf helm-v$HELM_VERSION-linux-arm.tar.gz

# see if it works
linux-arm/helm ls

# move helm to a location in your path
sudo mv linux-arm/helm /usr/local/bin

# cleanup
rm -rf helm-v$HELM_VERSION-linux-arm.tar.gz linux-arm

# Note: if you downloaded the arm64 bit version you would get this error
#  linux-arm64/helm help
#  -bash: linux-arm64/helm: cannot execute binary file: Exec format error

With helm installed you can configure it to reference the latest repositories and to work with the cluster you configured.

# configure helm  to add the official stable charts repository:
helm repo add stable https://kubernetes-charts.storage.googleapis.com/

# add bitnami repository:
helm repo add bitnami https://charts.bitnami.com/bitnami

With the Helm repositories configured we can now install applications into our cluster. If you would like to install the Kubernetes Dashboard follow the installation procedures here.

At this point you have everything you need to create, replicate, install and run your applications in K3S. After you’re done playing with your K3S cluster you can tear it down and cleanup artifacts using the following commands.

K3S cluster cleanup

# Uninstall K3S Server
/usr/local/bin/k3s-uninstall.sh

# Uninstall K3S Agents
/usr/local/bin/k3s-agent-uninstall.sh

I hope you’ve enjoyed this brief introduction on getting started with K3S in resource limited environments. I look forward to expanding upon these basic building blocks in future posts!

Home wine making

Both relaxing and rewarding, if you’re patient enough to wait for your pipeline to fill with homemade product.

I got my start into home wine making partly inspired by Ray Bradbury’s story Dandelion Wine. The thought of being able to capture time in a bottle, not just any time but summertime, caught my fancy. During the long, cold, dark nights of winter you could pop the cork, smell the sweet intoxicating scents of summer and dream of happier times.

One of the first signs of spring to make their appearance is those hearty yellow flowers beginning to bloom. I walked to the local library where they could be picked without fear of contaminants, such as weed killers. Here’s a dandelion wine recipe for the curious. Dandelions don’t make the best ingredient for wine making, they have none a the raw materials which fermentation depends upon, like sugars. While it’s fun, relatively easy and rewarding dandelions aren’t in the same class as natures sweetest fruit, the grape.

Basic skills needed for home wine making

If you can follow a basic recipe and have the patience to wait for the wine to complete it’s rest in the bottle, then you can probably make good wine. Notice how I encapsulated the algorithm in an if/then statement.

# Wine making algorithm
boolean patient = true
if (patient) {
  result = "You will probably be able to create great wines"
} else {
  result = "Continue buying overpriced product from your merchant"
}

return result

With the successful venture of dandelion wine under my belt, I was ready to branch out into uncharted waters, but keeping my boat close to the shore. For me it was a step-by-step process, taking baby steps first. Scouring the internet for recipes I also found a number of home brew suppliers which also carried wine making equipment and juices.

Home wine making quickstart

My favorite among these was Midwest Brewing, they had a great catalog which I could browse through offline. While tempted to pick up home brewing, it was apparent from the 80+ pages that I could pump thousands of $’s into home brewing and would probably need to add an addition onto the hacienda to keep it all. No, wine making for me was a simpler proposition taking up far less storage space and if I decided to bail out on the hobby there would be less surplus to sell off on eBay.

After you have a basic starter kit, you can get wine a recipe kit which includes the pressed juice from some of the best wine regions around the world. There’s usually 5-6 steps to follow and all of the ingredients needed to produce a batch of 30 bottles in 30 days. A little back of the envelope math shows that you can get in for between $2 – $5 per bottle, depending on the quality of the juice you buy. Juices from world class regions will cost you about $5 per bottle, but if you prefer good wine it’s worth it.

If you’re like me, you’ll start with a modestly priced wine to get the kinks out of your manufacturing process, then increase the juice ingredient cost as your process improves. In about half a year you can have a substantial wine cellar. Shown on the left is a can of 1 step cleaning powder which you mix 1 tbsp with a gallon of water. The cleaner is used on all our wine making equipment and bottles. It’s both sanitary and food safe. The worst enemy to wine making is uninvited contaminants, which the cleaning solution remedies. Also shown in the picture are a bottle corker and corks.

To save some $’s on bottles and their shipping cost, I discovered that if you over-tip the wait staff at wine bars they’re only too happy to save their empty bottles for you. I know that some of you are thinking you could leave the labels on the expensive bottles, refill them with your homemade wine, heat shrink a new hat over the cork and voila! If you’re thinking about trying something like this, my answer to that is: no, no, no and no. It’s been tried before, and aside from being unethical and illegal it’s also uncool, so don’t do it.

When your fermentation is complete, when the wine has clarified and stabilized you’re ready to begin bottling.

Bottling the wine
With cleaned bottles decorating the tree, we siphon the wine from the carboy into a container from which we’ll fill the bottles.

The bottle tree has a manual pump in the bowl on top, you add some of the cleaning solution and pump until the bottle is clean.

Decorate the tree with the bottles and the cleaner drains out. While the bottles are draining you can siphon the wine from the carboy into the primary fermentation bucket. It’s a food grade container and you shouldn’t try improvising with one which isn’t. I have an extra one with a spigot which I use to fill the bottles.

Preparing for bottling

During the bottle washing process I also added the corks to a bowl with the cleaning solution. The wet cork will be easier to get into the bottles. When bottling is complete they should be left in your basement standing up for a few days. Label your bottles, record when they were bottles and what you made. Then you should forget about them for at least a year. Certainly any leftovers or bottles that can’t be filled up to the shoulders should be kept aside and tasted during the process.

There should be a small air gap between the bottom of the cork and the shoulders of the bottle. If you cant fill the bottle you may as well drink it. Your wine will improve with time, so temper your expectations when consuming an immature bottle.

The wine shown in the pictures comes from our own modest vineyard, it’s a mix of concord and muscadine grapes, which are indigenous to our region, but not sought after in terms of quality wine. They’re better for jam, but I wanted to try a recipe from scratch. Last year the hot dry season produced an exceptional crop of grapes, I made the batch following these guidelines.

When you’re ready to try a recipe from scratch, consider buying 50 – 100 pounds of grapes from a local vineyard. You’ll need a fruit press to crush the grapes and a source for the other ingredients which come in the kit.

I hope you enjoyed this brief introduction and a ready to put these new learning skills to good use!

Playing with Istio

If you can’t measure it, you can’t manage it.

Peter Drucker

Istio is a Service Mesh, which is another term for: a network of containerized applications working together to discover, measure, manage, load balance, monitor and possibly recover your application. In the setup which follows, we’ll go through the process of starting a GKE cluster and deploying a sample application connected through an Istio sidecar.

This article intends to give you an understanding of what it takes to run your Kubernetes applications injected with Istio instrumentation. In future posts we’ll get further into the details of building upon this base of knowledge. So lets get the configurations out of the way first.

Download and install Istio for your operating system. If you’re installing on windows be sure to get the archive which contains the examples, we’ll be using them later.

As your Kubernetes depoyments get more and more complex, you’re going to need a Service Mesh like Istio to both give you insights into operations and to manage your applications. In this post we’ll move a bit faster from a setup standpoint, having benefited from our earlier work in Terraforming K8S Cluster creation and it’s prerequisite posts.

I’ll be following Google’s Istio Install instructions, and have described below the configuration i’m using to create my Istio cluster in GKE. You can follow along or try your own configuration using Terraform or YAML scripting.

Settings for my GKE cluster create

# My cluster parameters
Cluster name = playing-with-istio
Zone = us-east1-b
default-pool --> Number of Nodes = 4
Cluster Features = Enable Istio

Unless specified above, I left the other cluster create settings as default. Once your configuration is complete, go ahead and create your cluster.

I’ll continue to use the last project I configured in our earlier Terraform example to prepare for this project. You might find the commands below useful with the initial project setup.

Configure project settings

# list your projects
$ gcloud projects list

# set the project to the one in which the cluster was created
#  replace terraform-15209 with your project name
$ gcloud config set project terraform-15209

# list the cluster
$ gcloud container clusters list

# fetch cluster auth (after cluster is running)
$ gcloud container clusters get-credentials playing-with-istio

You might be wondering what all this new configuration and sidecar setup is doing for us. To that end, lets take a deeper look into what a sidecar is and what capabilities they’ll add to our projects.

In our earlier posts on Kubernetes, we talked about a 1 to 1 relationship between pods and containers, while this is generally the case there are patterns where two or more containers may collaborate within a pod. The sidecar pattern is one such example. Istio is a sidecar container which essentially injects service mesh capabilities into your application container which aren’t there by default. It accomplishes this by creating a proxy between your container and the Kubernetes control plane when your container is started. The Pilot manages and configures the proxies to route traffic. Kubernetes will also configure Mixers to enforce policies and collect telemetry. The Citadel can be configured to provide secure transports between services.

The main purpose of the Istio sidecar is to provide your container with service mesh capabilities such as: logging, monitoring, telemetry, instrumentation and more without you having to customize them in your application container. You leverage Kubernetes standards and best practices which have been hardened and tested in PROD, by many other applications. Hopefully by now your cluster is created and running.

After your cluster has been started, click on Services and Gateways to see the Istio Service Pods and Ingress Gateway running.

We can now cut over from the Google Istio Install procedure we were following to the Istio Getting Started procedure to launch a demo app. We’ll be going through those steps below, the getting started link is provided for more detailed reference.

Istio provides several configuration profiles to help get started, eventually you’ll create your own profile. To get started we’ll be using the Demo profile, which will give us access to the largest set of potential Services we may want to use. Istio profiles provide customization of the Istio control plane and to the sidecars in the Istio data plane, that are necessary when your application configurations become more complex.

While Demo provides the greatest potential set of services, Default provides the least options and may be more appropriate for a PROD environment. This is something you’ll need to consider when you decide to leave our sandbox environment and need to think harder about securing your applications.

Configure Istio to use the Demo profile

# configure istio to use demo profile
$ istioctl manifest apply --set profile=demo

- Applying manifest for component Base...
✔ Finished applying manifest for component Base.
- Applying manifest for component Pilot...
✔ Finished applying manifest for component Pilot.
  Waiting for resources to become ready...
  Waiting for resources to become ready...
    ...
  Waiting for resources to become ready...
- Applying manifest for component EgressGateways...
- Applying manifest for component IngressGateways...
- Applying manifest for component AddonComponents...
✔ Finished applying manifest for component EgressGateways.
✔ Finished applying manifest for component IngressGateways.
✔ Finished applying manifest for component AddonComponents.

Next you’ll need to configure a namespace label so Istio can automatically inject Envoy sidecar proxies when you deploy your applications.

Configuring Default namespace

# configure istio app namespace
$ kubectl label namespace default istio-injection=enabled
namespace/default labeled

If you haven’t already done so, change your directory to the Root where you installed Istio and the samples. On my Windows 10 laptop I installed in my C:\Tools directory. Our next configurations will be relative to this location and use the provided YAML configurations in that folder.

# change directory to the Istio Root folder
C:\> cd C:\Tools\istio-1.5.0

Deploy the Istio sample Book application

# deploy istio sample application
$ kubectl apply -f samples/bookinfo/platform/kube/bookinfo.yaml

service/details created
serviceaccount/bookinfo-details created
deployment.apps/details-v1 created
service/ratings created
serviceaccount/bookinfo-ratings created
deployment.apps/ratings-v1 created
service/reviews created
serviceaccount/bookinfo-reviews created
deployment.apps/reviews-v1 created
deployment.apps/reviews-v2 created
deployment.apps/reviews-v3 created
service/productpage created
serviceaccount/bookinfo-productpage created
deployment.apps/productpage-v1 created

You will notice that the sample Book application should start. As each pod becomes ready, the Istio sidecar will deploy along with it. The unique names and possibly the cluster IP address will be different for you.

List services and pods

# verify the sample Book services are running
$ kubectl get services
NAME          TYPE        CLUSTER-IP    EXTERNAL-IP   PORT(S)    AGE
details       ClusterIP   10.0.10.170   <none>        9080/TCP   2m57s
kubernetes    ClusterIP   10.0.0.1      <none>        443/TCP    33m
productpage   ClusterIP   10.0.5.196    <none>        9080/TCP   2m56s
ratings       ClusterIP   10.0.12.233   <none>        9080/TCP   2m57s
reviews       ClusterIP   10.0.2.78     <none>        9080/TCP   2m56s

# verify the sample Book pods are running
$ kubectl get pods
NAME                              READY   STATUS    RESTARTS   AGE
details-v1-c5b5f496d-ngczl        2/2     Running   0          3m10s
productpage-v1-7d6cfb7dfd-kplnp   2/2     Running   0          3m8s
ratings-v1-f745cf57b-fmmwq        1/2     Running   0          3m9s
reviews-v1-85c474d9b8-mrxz5       1/2     Running   0          3m9s
reviews-v2-ccffdd984-d2hq6        1/2     Running   0          3m9s
reviews-v3-98dc67b68-ddr9z        2/2     Running   0          3m9s

To run the Verification step described in the Istio Getting started guide, you’ll need a Linux shell. But, if you’re running from Windows 10 like I am you’ll have better luck using a Git Bash shell. I’m assuming you have Git installed, otherwise this might be a good place to stop (developer humor ha ha, why else would you be reading this).

Verify you can reach the Book Product page

# retrieve html title tag using Git Bash shell from Windows 10 laptop
$ kubectl exec -it $(kubectl get pod -l app=ratings -o jsonpath='{.items[0].metadata.name}') -c ratings -- curl productpage:9080/productpage | grep -o "<title>.*</title>"

Unable to use a TTY - input is not a terminal or the right kind of file
  % Total    % Received % Xferd  Average Speed   Time    Time     Time  Current
                                 Dload  Upload   Total   Spent    Left  Speed
100  4363  100  4363    0     0   2087      0  0:00:02  0:00:02 --:--:--  2088
<title>Simple Bookstore App</title>

Now that you can successfully reach the deployed application, we can associate it with the Istio gateway and expose it to the outside world.

# associating our sample application with the istio gateway
$ kubectl apply -f samples/bookinfo/networking/bookinfo-gateway.yaml

gateway.networking.istio.io/bookinfo-gateway created
virtualservice.networking.istio.io/bookinfo created

# verify the gateway has been created
$ kubectl get gateway

NAME               AGE
bookinfo-gateway   50s

# retrieve the gateway association
kubectl get svc istio-ingressgateway -n istio-system

NAME                   TYPE           CLUSTER-IP   EXTERNAL-IP    PORT(S)                                                                                                                                      AGE
istio-ingressgateway   LoadBalancer   10.0.5.173   35.237.34.14   15020:31647/TCP,80:31912/TCP,443:32074/TCP,31400:32203/TCP,15029:32016/TCP,15030:31712/TCP,15031:31852/TCP,15032:31556/TCP,15443:30117/TCP   59m

We’re almost ready to test our sample application from the browser, but first we’ll need to determine how to reach it running inside the GKE cluster. If you’re on Windows, run these commands form Git Bash. You can cheat and look for the IP address of the istio-ingressgateway in the browser on the Services & Ingress page, but you’ll need these environment variables later when you open the Kiali browser tab from your shell.

# determine external address to GKE gateway
$ export INGRESS_HOST=$(kubectl -n istio-system get service istio-ingressgateway -o jsonpath='{.status.loadBalancer.ingress[0].ip}')

$ export INGRESS_PORT=$(kubectl -n istio-system get service istio-ingressgateway -o jsonpath='{.spec.ports[?(@.name=="http2")].port}')

$ export SECURE_INGRESS_PORT=$(kubectl -n istio-system get service istio-ingressgateway -o jsonpath='{.spec.ports[?(@.name=="https")].port}')

# build the Gateway URL
$ export GATEWAY_URL=$INGRESS_HOST:$INGRESS_PORT
$ echo $GATEWAY_URL
35.237.34.14:80

You should now be able to reach the product page through the gateway url. Your IP address will be different than mine, and mine will be destroyed after I complete the cleanup, but the url should look like the one below.

# product page url - use your gateway IP address
http://35.237.34.14/productpage

You can now get a sense for some default monitoring provided by the sidecar using Kiali. Kiali is a console for Istio with service mesh configuration capabilities.  Lets go ahead and open a browser tab to Kiali, login using user admin and password admin.

# open browser to kiali
istioctl dashboard kiali

Your basic setup is now complete, you should be able to navigate through some of the screens in Kiali to get a better sense for default monitoring capabilities you can get from Istio out-of-the-box. Don’t be disappointed if you don’t see the graph page the getting started document shows, it has a dependency on Prometheus that the default install didn’t provide for us.

To remove Istio roles, permissions and resources.

# deletes the RBAC permissions, the istio-system namespace, and all resources hierarchically
$ istioctl manifest generate --set profile=demo | kubectl delete -f -

Be sure to destroy your cluster when you’ve complete playing so that you stop incurring charges. I hope you enjoyed this post and look forward to going further in depth in a later article.

Terraform K8S cluster creation

Planning ahead for deploying our microservices at scale.

In our article on Lifting Kubernetes up to the Cloud, we followed a step-by-step approach to get our Kubernetes clusters running in GCP. This approach is fine when you have a onesy or twosy microservices. But, when you have tens or thousands or tens of thousands we’ll need a better automated approach that scales. That’s where Teraform comes in.

With Teraform we define our infrastructure as code and can deploy into Azure, AWS, Google, Oracle and many other clouds. Teraform allows you to deploy, update and destroy infrastructure solutions without touching a web console. It integrates seamlessly with CICD pipelines. To get started you’ll need to download Teraform for your OS. After you’ve installed and configured Teraform to your path, run teraform with no options to see the available commands. We’ll play with a handful of these when we create our GKE cluster.

Lets get started by logging in to the Google Cloud Platform and creating a new project. Click on Select a project then New Project. For the project name enter terraform and keep the unique number Google provides so that the result looks something like this: terraform-15209. The parent organization can be left blank. Click Create and GCP will create your new project.

Next we’ll need to create a Service Account so that we can interact with GCP from a gcloud shell using Teraform. Service Accounts can be found under the IAM & Admin menu. In our service account we’re going to bind some access permissions. Under service accounts, select Create Service Account, then enter terraform for the service account name and leave the service account id as is. Go ahead and enter a Description and click Create.

Click Role and choose the Editor role, Add another role choose Kubernetes Engine –> Kubernetes Engine Admin. Select Continue and Create a Key, create the JSON key type and it will download to your machine. Be sure to keep this key private, it provides access to your kingdom.

With your secret key downloaded, create a folder for your project and move your key into it. Rename the key to: service-account.json. Create the file below and name it main.tf.

If you don’t already have the Google Cloud SDK (gcloud) installed go ahead and install it now. Open a gcloud shell and change into your project folder. Run the gcloud command to get a list of your projects, you should see the terraform project you created earlier.

# Get a list of your projects
$ gcloud projects list
PROJECT_ID                      NAME                     PROJECT_NUMBER
terraform-15209                 terraform-15209          849873418072

Create the Terraform script below for creating a cluster from the shell. Be sure to replace all instances (3) of my project name terraform-28892 with your from the command above.

Main.tf – Terraform script to create GCP Cluster

provider "google" {
  # rename your saved credentials to: service-account.json
  credentials = "${file("service-account.json")}"
  project = "terraform-28892"
  # change your region and zone to suit your location preference
  region  = "us-east1"
  zone    = "us-east1-c"
}

resource "google_container_cluster" "primary" {
  name        = "my-terraformed-k8s"
  project     = "terraform-28892"
  description = "Demo GKE Cluster"
  location    = "us-east1-c"

  # We can't create a cluster with no node pool defined, but we want to only use
  # separately managed node pools. So we create the smallest possible default
  # node pool and immediately delete it.
  remove_default_node_pool = true
  initial_node_count = "1"

  # Setting an empty username and password explicitly disables basic auth
  master_auth {
    username = ""
    password = ""

    client_certificate_config {
      issue_client_certificate = false
    }
  }
}

resource "google_container_node_pool" "primary_preemptible_node" {
  name       = "default-node-pool"
  project     = "terraform-28892"
  location   = "us-east1-c"
  cluster    = google_container_cluster.primary.name
  node_count = 1

  node_config {
    preemptible  = true
    machine_type = "n1-standard-1"

    metadata = {
      disable-legacy-endpoints = "true"
    }

    oauth_scopes = [
		"https://www.googleapis.com/auth/devstorage.read_only",
		"https://www.googleapis.com/auth/logging.write",
		"https://www.googleapis.com/auth/monitoring",
		"https://www.googleapis.com/auth/servicecontrol",
		"https://www.googleapis.com/auth/service.management.readonly",
		"https://www.googleapis.com/auth/trace.append",
    ]
  }
}

With the main.tf created lets initialize Teraform to pull down the artifacts it needs to build a cluster in the GKE. After we run init, we’ll run terraform plan to get an idea of what Terraform is going to create for us. At this point the command is run locally and won’t interact with the cloud.

# Download Terraform components needed to work with Google CLoud
terraform init
* provider.google: version = "~> 3.12"

Terraform has been successfully initialized!

# Run 
$ terraform plan

If all goes according to plan you’re ready to apply your plan and create a cluster.

# execute the plan
$ terraform apply

You should get an error telling you that the Kubernetes SDK hasn’t been used yet in your new project, which is true, it hasn’t. Follow the link Google provides and the remedy they recommend, then run the apply command again when the Kubernetes Engine is enabled.

It should take several minutes, or so, to create your cluster and node. You should get a message indicating: Apply complete! Resources: 2 added, 0 changed, 0 destroyed.

At this point, you may need to run the kubectl version command. If you get an x509 certificate error, you can reload your cert for the new cluster you created.

$ kubectl version
Unable to connect to the server: x509: certificate signed by unknown authority

# Change you zone if needed and project name using your project name (from above)
$ gcloud container clusters get-credentials my-terraformed-k8s \
    --zone us-east1-c --project terraform-28892

Fetching cluster endpoint and auth data.
kubeconfig entry generated for my-terraformed-k8s.

# rerun kubectl 
$ kubectl version

At this point you can go back to the article Lifting Kubernetes up to the Cloud, picking up at section: Deploy our basic service, if you would like to deploy our test dummy container, create gateway and scale it up.

When you’re done playing don’t forget to run the cleanup so the billing stops. To delete your cluster you can run terraform destroy.

$ terraform destroy

# after several minutes or a tall pint
Destroy complete! Resources: 2 destroyed.

I hope you’ve gotten a good feel for the power and capabilities of Terraform for creating infrastructure as code. the CLI API guide has an extensive rich set of commands you can apply across a number of different clouds helping make you a better devsecops profesional.